Uk Trade - July 2024
11th September 2024

The value of goods imports decreased by £1.5 billion (3.0%) in July 2024, with a fall in imports from both EU and non-EU countries.
The value of goods exports fell by £3.4 billion (10.8%) in July 2024, with exports to both EU and non-EU countries decreasing, following a large rise the previous month.
The substantial fall in exports was driven by lower chemical exports to both EU and non-EU countries.
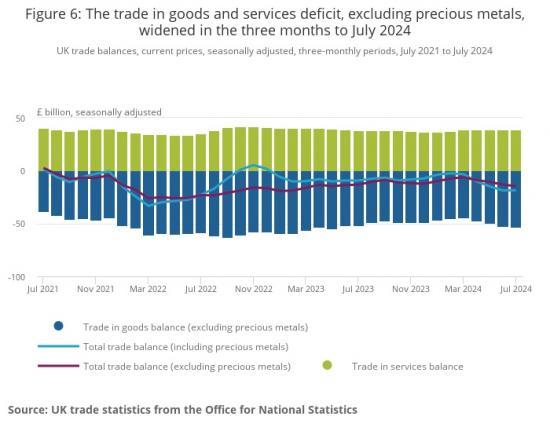
The total goods and services trade deficit widened by £5.5 billion to a deficit of £14.6 billion in the three months to July 2024, driven by increased imports of goods.
The trade in goods deficit widened by £5.9 billion to £53.5 billion in the three months to July 2024, while the trade in services surplus is estimated to have widened by £0.3 billion to £38.9 billion.
Goods imports
Imports from the EU decreased by £0.5 billion (2.0%) in July 2024, with falls of £0.2 billion in imports of food and live animals, material manufactures and miscellaneous manufactures (Figure 3). These decreases were caused by small changes across multiple countries and commodities.
Imports from non-EU countries decreased by £0.9 billion (4.1%) in July 2024. This was mainly because of a £0.7 billion fall in fuel imports, linked to reduced imports of crude oil from Norway and refined oil from Saudi Arabia. There was also a £0.3 billion fall in machinery and transport equipment, driven by reduced imports of mechanical machinery from the United States and cars from China.
Goods exports
Exports to the EU decreased by £1.7 billion (10.8%) in July 2024, with a £0.5 billion fall in chemical exports and a £0.4 billion fall in exports of machinery and transport equipment (Figure 4). There were also smaller decreases in exports of fuels, miscellaneous manufactures, and material manufactures, each falling by £0.2 billion.
The fall in chemical exports was because of reduced exports of medicinal and pharmaceutical products, and organic chemicals to Ireland. The fall in exports of machinery and transport equipment was driven by reduced exports of aircraft to Germany.
Exports to non-EU countries decreased by £1.8 billion (10.8%) in July 2024. This was mainly because of a £0.7 billion fall in chemical exports, driven by reduced exports of inorganic chemicals and medicinal and pharmaceutical products to the United States.
Exports of both miscellaneous manufactures, and machinery and transport equipment fell by £0.3 billion. This was driven by reduced exports of other manufactures to Switzerland and reduced exports of mechanical machinery to South Korea, respectively.
Monthly trade in services
Early estimates suggest imports of services increased by around £1.1 billion (4.1%) in value terms in July 2024, while services exports remained stable (Figure 5). Although relatively high prices continue to affect trade in services in recent months, in July 2024, there was little difference between trade in services trends in value and inflation-adjusted terms. Imports in inflation-adjusted terms increased by £1.1 billion (4.9%), while exports remained stable.
Monthly figures for trade in services for July 2024 are estimated from Quarter 2 (Apr to June) 2024 data, using additional data sources. Our UK Trade Quality and Methodology Information (QMI) has more detail on how our trade in services statistics are compiled.
The S&P Global Purchasing Managers' Index for July 2024 reported growth in service sector activity, although at a slower rate than recent months. Indicators suggest a further slowing of rates in the months ahead. Demand for business services improved, although growth in financial services was slower. Consumer-facing services saw weaker activity and demand in July.
he total goods and services trade balance, excluding precious metals, widened by £5.5 billion to a deficit of £14.6 billion in the three months to July 2024, compared with the three months to April 2024. This was driven by an increase in imports of goods (Figure 6). Total imports increased by £7.1 billion over this period, and exports rose by £1.5 billion. When removing the effect of inflation, the total trade deficit, excluding precious metals, widened by £3.7 billion to £13.8 billion.
The trade in goods deficit in value terms, excluding precious metals, widened by £5.9 billion to £53.5 billion in the three months to July 2024, as goods exports fell while imports rose. The trade in services surplus is estimated to have widened by around £0.3 billion to £38.9 billion, because of a larger increase in services exports than imports.
Read the full ONS report HERE
