Economic Activity And Social Change In The Uk Real-time Indicators: 28 November 2024
28th November 2024

Overall retail footfall decreased by 5% in the week to 24 November 2024 when compared with the previous week and was 10% lower when compared with the equivalent week of 2023 (MRI OnLocation). Section 3: Consumer behaviour.
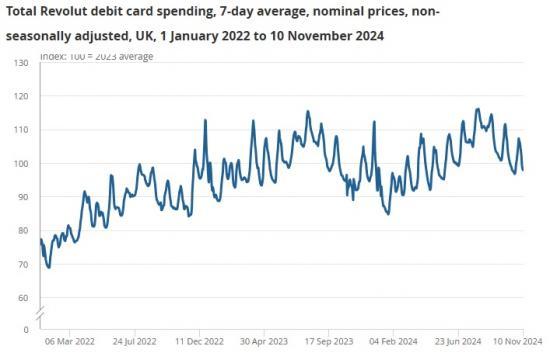
UK credit and debit card payments increased by 4% in the week to 22 November 2024 when compared with the previous week but decreased by 16% when compared with the equivalent week of 2023; total Revolut debit card spending increased by 5% in the week to 10 November 2024 when compared with the equivalent week of 2023 (Bank of England, Revolut). Section 3: Consumer behaviour.
The Business Insights and Conditions Survey (BICS) standardised turnover balance estimate decreased by 0.6 percentage points between September and October 2024 (final results from Wave 120 of the BICS). Section 4: Business and workforce.
The System Average Price (SAP) of gas increased by 3% to 3.962 pence per kilowatt hour (p/kWh) in the week to 24 November 2024 when compared with the previous week but decreased by 1% when compared with the equivalent week of 2023; the System Price of electricity decreased by 7% to 8.735 p/kWh when compared with the previous week, but increased by 3% when compared with the equivalent week of 2023 (National Gas Transmission, Elexon). Section 5: Energy.
The number of ship visits to major UK ports decreased by 11% in the week to 24 November 2024 when compared with the previous week and decreased by 13% when compared with the equivalent week of 2023; the number of UK flights decreased by 3% in the most recent week but was broadly unchanged against the equivalent week of 2023 (exactEarth, EUROCONTROL). Section 6: Transport.
The total number of Energy Building Performance Certificates (EPCs) for new dwellings across England and Wales in the week to 24 November 2024 was 5% lower when compared with the equivalent period of 2023 (Ministry of Housing, Communities and Local Government). Section 7: Housing.
UK credit and debit card payments
Aggregate UK credit and debit card payments increased by 4% in the week to 22 November 2024 compared with the previous week but decreased by 16% when compared with the equivalent week of 2023.
Weekly and monthly UK credit and debit card payment indices are available in our accompanying UK credit and debit payments dataset.
Revolut spending on debit cards
This week sees the reintroduction of our Revolut spending on debit card estimates. These data were paused temporarily to implement an improved methodology and enhanced quality assurance processes for these data. Our Revolut spending on debit card estimates were last updated in January 2024. The estimates published in this release, and in our accompanying dataset, replace those previously available.
High street and shopping centre footfall both decreased in the week to 24 November 2024 by 9% and 2%, respectively, when compared with the previous week, while retail park footfall remained broadly unchanged. When compared with the equivalent week of 2023, both high street and shopping centre footfall decreased by 15% and 9%, respectively, while retail park footfall increased by 1%.
When compared with the previous week, overall retail footfall decreased in all 12 of the UK regions. The largest week-on-week decreases were in Yorkshire and The Humber, the North East and the North West of England, where retail footfall decreased by 13%, 10% and 10%, respectively.
When compared with the equivalent week of 2023, overall retail footfall decreased in all 12 of the UK regions. The largest year-on-year decrease was in the South West of England, which fell by 18%.
The week-on-week and year-on-year decreases in footfall, across all regions, may have been a result of reduced movement surrounding "Storm Bert" and the adverse weather conditions over this period.
Automotive fuel spending
The annual growth rate in average fuel price increased by 1 percentage point in the week to 17 November 2024, compared with the previous week, but was 2 percentage points lower than the equivalent week of 2023.
The annual growth rate in the estimated fuel demand per transaction remained broadly unchanged in the week to 17 November 2024 when compared with both the previous week and the equivalent week of 2023.
System Average Price of gas
The System Average Price (SAP) of gas increased by 3% in the week to 24 November 2024 compared with the previous week, from a seven-day average price of 3.849 pence per kilowatt hour (p/kWh) to 3.962 p/kWh. This was 1% lower than the equivalent week of 2023, which had a seven-day average price of 4.006 p/kWh.
Our accompanying System Average Price of gas dataset is available.
System Price of electricity
The System Price of electricity decreased by 7% in the week to 24 November 2024 compared with the previous week, from a seven-day average price of 9.409 pence per kilowatt hour (p/kWh) to 8.735 p/kWh. This was 3% higher than the equivalent week of 2023, which had a seven-day average price of 8.493 p/kWh.
Read the full detailed ONS report HERE
