GDP monthly estimate UK - February 2025 - Up 0.5%
11th April 2025
Monthly real gross domestic product (GDP) is estimated to have grown by 0.5% in February 2025, with growths in all main sectors, following January 2025 which showed no growth (revised up from a fall of 0.1% in our previous publication).
Real GDP is estimated to have grown by 0.6% in the three months to February 2025, compared with the three months to November 2024, mainly because of growth in the services sector.
Monthly services output grew by 0.3% in February 2025, following unrevised growth of 0.1% in January 2025, and grew by 0.6% in the three months to February 2025.
Production output grew by 1.5% in February 2025, following a fall of 0.5% in January 2025 (revised up from a 0.9% fall in our previous publication), and grew by 0.7% in the three months to February 2025, with manufacturing output driving the monthly and three-month growths.
Construction output grew by 0.4% in February 2025, following a fall of 0.3% in January 2025 (revised down from a fall of 0.2% in our previous publication), but showed no growth in the three months to February 2025.
Monthly GDP
Monthly real gross domestic product (GDP) is estimated to have grown by 0.5% in February 2025, with growths in all main sectors, following January 2025 which showed no growth (revised up from a 0.1% fall in our previous publication)
Real GDP is estimated to have grown by 0.6% in the three months to February 2025, compared with the three months to November 2024, mainly because of growth of 0.6% in the services sector. Production sector output also rose in this period, by 0.7%, while construction showed no growth.
The largest positive contribution in the services sector in February 2025 came from the information and communication subsector where output rose by 2.2% on the month, following a fall of 0.4% in January 2025. At the industry level in this subsector there were widespread rises with five of the six industries growing in February 2025; the largest positive contributions came from computer programming, consultancy and related activities (up 2.0%), telecommunications (up 3.5%), and publishing activities (up 6.4%).
The next largest positive contribution at the subsector level in February 2025 came from the wholesale and retail trade; repair of motor vehicles and motorcycles subsector where output rose by 1.0% on the month, following growth of 0.6% in January 2025. All three industries in this subsector experienced growth in February 2025, with the largest contributions coming from a 3.0% increase in wholesale and retail trade and repair of motor vehicles and motorcycles and a 1.0% rise in retail trade, except of motor vehicles and motorcycles.
Administrative and support service activities grew by 1.3% in February 2025 for its third consecutive monthly growth. There were widespread increases in output (in five of the six industries) with a 2.0% rise in the office administrative, office support and other business support activities industry, providing the largest contribution to the subsector's growth.
The largest negative contribution in February 2025 came from other service activities which fell by 2.8% after growth of 3.4% in January 2025, driven by a 3.1% fall in the other personal service activities industry. Professional, scientific and technical activities also fell on the month, by 0.5%, mainly because of a 6.1% decline in the scientific research and development industry which follows a growth of 5.6% for this industry in January 2025.
An overview of data sources used in our estimates of service output can be found in our GDP(o) data sources catalogue. Our Monthly Business Survey (MBS) is used for 43.6% of the services sector by industry weight. The turnover response rate for the MBS element of the services sector was 89.1% in February 2025. We would expect this to increase over time as more responses are received. Any new data will be included in future monthly GDP releases. For context, the average turnover response rate for the service sector in 2023 and 2024 now stand at 97.5% and 97.2%, respectively.
Consumer-facing services
Output in consumer-facing services increased by 0.7% in February 2025, following a fall of 0.1% in January 2025 (revised down from a 0.1% rise in our previous publication). The largest contributions at the industry level came from a 3.0% growth in wholesale and retail trade and repair of motor vehicles and motorcycles, a 1.0% increase in retail trade, except of motor vehicles and motorcycles and a 2.1% rise in food and beverage service activities, while the largest partially offsetting fall came from a 3.1% decline in other personal service activities.
Consumer-facing services output rose by 0.6% in the three months to February 2025, compared with the three months to November 2024. The largest positive contributions in this period came from other personal service activities (up 4.8%) and travel agency, tour operator and other reservation service and related activities (up 8.1%). The largest partially offsetting fall came from wholesale and retail trade and repair of motor vehicles and motorcycles which fell by 1.5% in this three-month period.
The production sector
On the month, production output is estimated to have risen by 1.5% in February 2025, following a fall of 0.5% in January 2025 (revised up from a 0.9% fall in our previous publication). The increase in February 2025 was mainly driven by manufacturing output growing by 2.2% on the month. Electricity, gas, steam and air conditioning supply increased by 2.0% while water supply; sewerage, waste management and remediation activities increased by 1.1%. There was a partially offsetting fall of 3.0% in mining and quarrying in February 2025, after growth of 0.8% in January 2025 (revised up from a fall of 3.3% in our previous publication and the main reason for the upwards revision to production growth in January 2025).
In the three months to February 2025, production output is estimated to have grown by 0.7%. This period saw growths in three of the four subsectors: manufacturing (up 0.6%), water supply; sewerage, waste management and remediation activities (up 2.8%) and electricity, gas, steam and air conditioning supply (up 1.6%), while mining and quarrying output fell by 0.7% in the three months to February 2025.
Table of contents
Main points
Monthly GDP
The services sector
The production sector
The construction sector
Cross-industry themes
Revision to Monthly Gross Domestic Product
Monthly GDP data
Glossary
Data sources and quality
Related links
Cite this statistical bulletin
Print this Statistical bulletin
Download as PDF
1.Main points
Monthly real gross domestic product (GDP) is estimated to have grown by 0.5% in February 2025, with growths in all main sectors, following January 2025 which showed no growth (revised up from a fall of 0.1% in our previous publication).
Real GDP is estimated to have grown by 0.6% in the three months to February 2025, compared with the three months to November 2024, mainly because of growth in the services sector.
Monthly services output grew by 0.3% in February 2025, following unrevised growth of 0.1% in January 2025, and grew by 0.6% in the three months to February 2025.
Production output grew by 1.5% in February 2025, following a fall of 0.5% in January 2025 (revised up from a 0.9% fall in our previous publication), and grew by 0.7% in the three months to February 2025, with manufacturing output driving the monthly and three-month growths.
Construction output grew by 0.4% in February 2025, following a fall of 0.3% in January 2025 (revised down from a fall of 0.2% in our previous publication), but showed no growth in the three months to February 2025.
Back to table of contents
2.Monthly GDP
Monthly real gross domestic product (GDP) is estimated to have grown by 0.5% in February 2025, with growths in all main sectors, following January 2025 which showed no growth (revised up from a 0.1% fall in our previous publication)
Real GDP is estimated to have grown by 0.6% in the three months to February 2025, compared with the three months to November 2024, mainly because of growth of 0.6% in the services sector. Production sector output also rose in this period, by 0.7%, while construction showed no growth.
Note that early estimates of GDP are subject to revision in future publications (positive and negative). Please see our Why GDP figures are revised article for more information.
This publication contains revisions to January 2025 for the first time, while there are also revisions to January 2023 to December 2024 consistent with our GDP quarterly national accounts, UK: October to December 2024 bulletin, released on 28 March 2025.
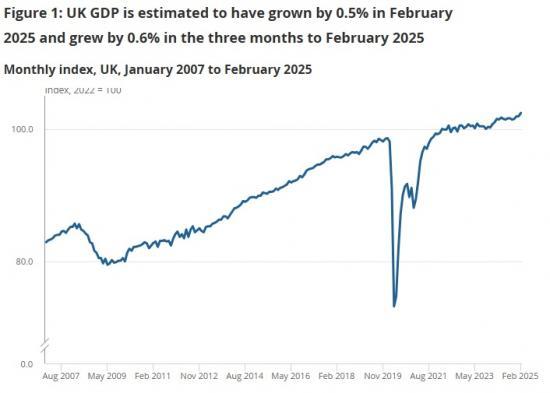
Figure 1: UK GDP is estimated to have grown by 0.5% in February 2025 and grew by 0.6% in the three months to February 2025
Monthly index, UK, January 2007 to February 2025
Feb 2025May 2023Aug 2021Nov 2019Feb 2018May 2016Aug 2014Nov 2012Feb 2011May 2009Aug 20070.080.0100.0Index, 2022 = 100
May 2019
● Monthly GDP: 97.4
Source: GDP monthly estimate from the Office for National Statistics
Download this chartFigure 1: UK GDP is estimated to have grown by 0.5% in February 2025 and grew by 0.6% in the three months to February 2025
Image .csv .xls
All three main sectors grew in February 2025: services output increased by 0.3% and was the largest contributor to the monthly growth in GDP, production output rose by 1.5%, and construction output increased by 0.4%.
Figure 2: All the main sectors contributed positively to the 0.5% growth in GDP in February 2025
Contributions to monthly gross domestic product (GDP) growth, UK, February 2024 to February 2025
GDPServicesProductionConstructionFeb 2024Apr 2024Jun 2024Aug 2024Oct 2024Dec 2024Feb 2025-0.40-0.200.000.200.400.600.80Percentage points
Jun 2024
● GDP: -0.20
● Services: -0.20
● Production: 0.03
● Construction: 0.01
Source: GDP monthly estimate from the Office for National Statistics
Notes:
Component contributions may not sum to total growth because of rounding.
GDP growth rates are rounded to one decimal place.
Download this chartFigure 2: All the main sectors contributed positively to the 0.5% growth in GDP in February 2025
Image .csv .xls
More about economy, business and jobs
Explore the latest trends in employment, prices and trade in our economic dashboard.
View all economic data.
Looking over the longer term, GDP is estimated to have grown by 1.4% in the three months to February 2025, compared with the three months to February 2024. Over this period services grew by 1.8%, while production fell by 0.5% and construction grew by 1.0%.
Compared to the same month a year ago, GDP is estimated to be 1.4% higher in February 2025.
Back to table of contents
3.The services sector
Services output is estimated to have grown by 0.3% in February 2025, after unrevised growth of 0.1% in January 2025, and output increased in 9 of the 14 subsectors on the month.
Overall, the services sector is estimated to have grown by 0.6% in the three months to February 2025, compared with the three months to November 2024. There was a rise in output in 11 of the 14 subsectors in this period with the largest positive contributions coming from administrative and support service activities (up 1.9%), wholesale and retail trade; repair of motor vehicles and motorcycles (up 1.0%), and information and communication (up 1.6%) in the three months to February 2025. Figure 3 shows the monthly and three-month contributions at the subsector level for services in February 2025.
Figure 3: Services saw growth of 0.3% in February 2025, with 9 of the 14 subsectors showing growth on the month
Monthly and three-month services contributions to gross domestic product (GDP), UK, February 2025
MonthlyThree-monthInformation And CommunicationWholesale And Retail Trade; Repair Of Motor Vehicles And MotorcyclesAdministrative And Support Service ActivitiesAccommodation And Food Service ActivitiesReal Estate ActivitiesTransportation And StoragePublic Administration And Defence; Compulsory Social SecurityEducationArts Entertainment And RecreationActivities Of HH As Employers; Undifferentiated Goods- And Services-Activities Of HH For Own UseHuman Health And Social Work ActivitiesFinancial And Insurance ActivitiesProfessional Scientific And Technical ActivitiesOther Service Activities0.000.10-0.08-0.05-0.030.030.050.080.130.15Percentage points
Education
● Monthly: 0.01
● Three-month: -0.04
Source: GDP monthly estimate from the Office for National Statistics
Notes:
Component contributions may not sum to total services growth because of rounding.
Download this chartFigure 3: Services saw growth of 0.3% in February 2025, with 9 of the 14 subsectors showing growth on the month
Image .csv .xls
The largest positive contribution in the services sector in February 2025 came from the information and communication subsector where output rose by 2.2% on the month, following a fall of 0.4% in January 2025. At the industry level in this subsector there were widespread rises with five of the six industries growing in February 2025; the largest positive contributions came from computer programming, consultancy and related activities (up 2.0%), telecommunications (up 3.5%), and publishing activities (up 6.4%).
The next largest positive contribution at the subsector level in February 2025 came from the wholesale and retail trade; repair of motor vehicles and motorcycles subsector where output rose by 1.0% on the month, following growth of 0.6% in January 2025. All three industries in this subsector experienced growth in February 2025, with the largest contributions coming from a 3.0% increase in wholesale and retail trade and repair of motor vehicles and motorcycles and a 1.0% rise in retail trade, except of motor vehicles and motorcycles.
Administrative and support service activities grew by 1.3% in February 2025 for its third consecutive monthly growth. There were widespread increases in output (in five of the six industries) with a 2.0% rise in the office administrative, office support and other business support activities industry, providing the largest contribution to the subsector's growth.
The largest negative contribution in February 2025 came from other service activities which fell by 2.8% after growth of 3.4% in January 2025, driven by a 3.1% fall in the other personal service activities industry. Professional, scientific and technical activities also fell on the month, by 0.5%, mainly because of a 6.1% decline in the scientific research and development industry which follows a growth of 5.6% for this industry in January 2025.
An overview of data sources used in our estimates of service output can be found in our GDP(o) data sources catalogue. Our Monthly Business Survey (MBS) is used for 43.6% of the services sector by industry weight. The turnover response rate for the MBS element of the services sector was 89.1% in February 2025. We would expect this to increase over time as more responses are received. Any new data will be included in future monthly GDP releases. For context, the average turnover response rate for the service sector in 2023 and 2024 now stand at 97.5% and 97.2%, respectively.
Consumer-facing services
Output in consumer-facing services increased by 0.7% in February 2025, following a fall of 0.1% in January 2025 (revised down from a 0.1% rise in our previous publication). The largest contributions at the industry level came from a 3.0% growth in wholesale and retail trade and repair of motor vehicles and motorcycles, a 1.0% increase in retail trade, except of motor vehicles and motorcycles and a 2.1% rise in food and beverage service activities, while the largest partially offsetting fall came from a 3.1% decline in other personal service activities.
Consumer-facing services output rose by 0.6% in the three months to February 2025, compared with the three months to November 2024. The largest positive contributions in this period came from other personal service activities (up 4.8%) and travel agency, tour operator and other reservation service and related activities (up 8.1%). The largest partially offsetting fall came from wholesale and retail trade and repair of motor vehicles and motorcycles which fell by 1.5% in this three-month period.
More information on consumer-facing services data is available in our Consumer-facing services February 2025 dataset.
Figure 4: The wholesale and retail trade and repair of motor vehicles and motorcycles industry was the largest contributor to the 0.7% growth in consumer-facing services output in February 2025
Monthly and three-month consumer-facing services industry contributions to consumer-facing services output, UK, February 2025
MonthlyThree-monthWholesale And Retail Trade And Repair Of Motor Vehicles And MotorcyclesRetail Trade Except Of Motor Vehicles And MotorcyclesFood And Beverage Service ActivitiesSports Activities And Amusement And Recreation ActivitiesBuying And Selling Renting And Operating Of Own Or Leased Real Estate Excluding Imputed RentVeterinary ActivitiesRail TransportGambling And Betting ActivitiesActivities Of Households As Employers Of Domestic PersonnelTravel Agency Tour Operator And Other Reservation Service And Related ActivitiesAccommodationActivities Of Membership OrganisationsOther Personal Service Activities-0.20-0.100.000.100.200.30-0.300.40Percentage points
Other Personal Service Activities
● Monthly: -0.22
● Three-month: 0.32
Source: GDP monthly estimate from the Office for National Statistics
Notes:
Sum of component contributions may not sum to total consumer-facing services growth because of rounding.
Download this chartFigure 4: The wholesale and retail trade and repair of motor vehicles and motorcycles industry was the largest contributor to the 0.7% growth in consumer-facing services output in February 2025
Image .csv .xls
More detailed breakdowns on services are available in the Index of Services, UK: February 2025 bulletin.
Back to table of contents
4.The production sector
On the month, production output is estimated to have risen by 1.5% in February 2025, following a fall of 0.5% in January 2025 (revised up from a 0.9% fall in our previous publication). The increase in February 2025 was mainly driven by manufacturing output growing by 2.2% on the month. Electricity, gas, steam and air conditioning supply increased by 2.0% while water supply; sewerage, waste management and remediation activities increased by 1.1%. There was a partially offsetting fall of 3.0% in mining and quarrying in February 2025, after growth of 0.8% in January 2025 (revised up from a fall of 3.3% in our previous publication and the main reason for the upwards revision to production growth in January 2025).
In the three months to February 2025, production output is estimated to have grown by 0.7%. This period saw growths in three of the four subsectors: manufacturing (up 0.6%), water supply; sewerage, waste management and remediation activities (up 2.8%) and electricity, gas, steam and air conditioning supply (up 1.6%), while mining and quarrying output fell by 0.7% in the three months to February 2025.
Figure 5: Production output grew by 1.5% in February 2025, and by 0.7% in the three months to February 2025
Monthly index, UK, January 2022 to February 2025
Index of productionMining and quarryingManufacturingElectricity, gas, steam and air conditioning supplyWater supply; sewerage, waste management and remediation activitiesFeb 2025Aug 2024Feb 2024Aug 2023Feb 2023Aug 2022Feb 20220.075.0100.0125.0January 2022 =100
Dec 2024
● Index of production: 95.8
● Mining and quarrying: 77.3
● Manufacturing: 97.8
● Electricity, gas, steam and air conditioning supply: 111.6
● Water supply; sewerage, waste management and remediation activities: 95.7
Source: GDP monthly estimate from the Office for National Statistics
Notes:
Indexes are rounded to one decimal place.
Weights of these subsectors are available in the GDP(O) data sources catalogue.
Download this chartFigure 5: Production output grew by 1.5% in February 2025, and by 0.7% in the three months to February 2025
Image .csv .xls
Manufacturing output rose by 2.2% in February 2025, following a fall of 1.0% in January 2025 (revised up from a 1.1% fall in our previous publication), and this subsector was the largest contributor to the overall increase in production output.
Across manufacturing there was widespread growth in February 2025, with rises in 10 of the 13 manufacturing subsectors. The largest contribution was from a growth of 9.8% in the manufacturing of computer, electronic and optical products, following two consecutive falls in January 2025 (down 0.7%) and December 2024 (down 3.7%), and the index is now at its highest level since December 2021. There was also growth of 4.4% in the manufacture of basic pharmaceutical products and pharmaceutical preparations industry, following a fall of 3.4% in January 2025. The manufacture of transport equipment subsector increased by 1.8% in February 2025, driven by the manufacture of motor vehicles, trailers and semi-trailers industry growing by 2.6% on the month following growth of 0.8% in January 2025, but this industry remains 10.1% below its level in February 2024.
Looking more broadly, manufacturing output rose by 0.6% in the three months to February 2025, compared with the three months to November 2024, with 8 of the 13 subsectors growing over this period. The largest contributors here were the manufacture of machinery and equipment not elsewhere classified (n.e.c.), which was up 5.1% in the three months to February 2025. The manufacture of basic pharmaceutical products and pharmaceutical preparations industry had the second largest contribution in this period, growing by 2.8% in the three months to February 2025.
Our Monthly Business Survey (MBS) is used for 72.9% of the production sector by industry weight. The turnover response rate for the MBS element of the production sector was 88.3% in February 2025. We would expect this to increase over time as more responses from businesses are received. Any new data will be included in future monthly gross domestic product (GDP) releases, in line with our National Accounts revision policy. For context, the average turnover response rate for the production sector in 2023 and 2024 now stand at 97.7% and 97.5%, respectively.
The construction sector
Monthly construction output is estimated to have grown by 0.4% in February 2025, following a fall of 0.3% in January 2025 (revised down from a fall of 0.2% in our previous publication). The rise in monthly output in February 2025 came from both new work and repair and maintenance, which grew by 0.3% and 0.5%, respectively.
Construction output is estimated to have shown no growth in the three months to February 2025 compared with the three months to November 2024. New work increased by 1.2% over the period, whereas repair and maintenance fell by 1.5%. Within new work, the largest positive contributor came from public other new work, which grew by 11.4%. In repair and maintenance, the largest negative contributor came from private housing repair and maintenance, which fell by 3.2%.
Five out of the nine sectors saw increases in February 2025. At the sector level, the main contributors to the monthly increase were public other new work and public housing repair and maintenance, which grew by 4.4% and 4.0%, respectively.
Figure 8 shows both the monthly and three-month contributions to construction output from each of the construction sectors.
Read the full ONS report HERE