The impact of higher energy costs on UK businesses: 2021 to 2024
20th May 2025
UK electricity prices reflect the strong rise in gas prices since 2021, as the global economy moves out of the coronavirus (COVID-19) pandemic, and because of the war in Ukraine.
UK electricity prices are high by international comparisons, because of the relative dependence on gas compared with other sources, for example, nuclear, coal, and renewables.
Energy-intensive manufacturing industries, predominantly operating in international markets, consist of paper and paper products, petrochemicals, basic metals and castings, and inorganic non-metallic products.
Collectively, the volume of output in these industries has fallen by one-third since the start of 2021 and is now at its lowest level since the start of the available time series in 1990.
An overview of gas and electricity prices for UK non-domestic users
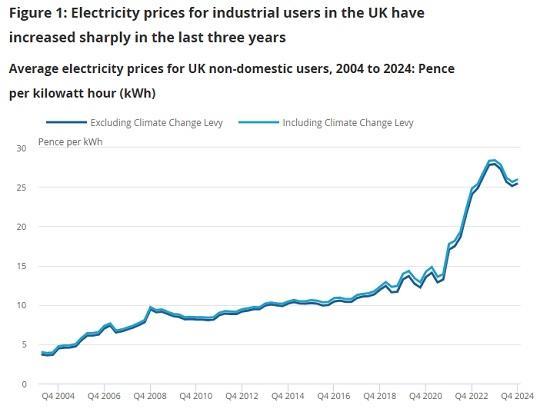
Since 2021, the average electricity price for UK non-domestic users has increased sharply from 14.81 pence per kilowatt hour (kWh) in 2021 Quarter 1 (Jan to Mar) to a peak of 28.39 pence per kWh in 2023 Quarter 4 (Oct to Dec) - a rise of over 90%. Since then, the average electricity price has fallen back to 25.97 pence kWh in 2024 Quarter 4. However, this is still 75% higher than the average price at the start of 2021 (see Figure 1).
Over the same period, the average gas price for UK non-domestic users has followed a similar trajectory. This increased nearly three-fold from 2.50 pence per kWh in 2021 Quarter 1 to 7.18 pence per kWh in 2023 Quarter 1. The average gas price has since fallen back to 5.52 pence per kWh, but this is still more than double the average price in 2021 Quarter 1
Despite falling prices over the last two years, average gas prices for industrial users are more than double those at the beginning of 2021.
In the UK there is a very close association between gas and electricity prices, which follows from the way the system price of electricity is determined. The system price is set by the most expensive supply bid accepted from the various electricity generators. The electricity generation plants whose bid determines the system price are called "price setter", or "price maker", or "plants at the margin", while those with bids lower than this price are called "price taker" or "infra-marginal" plants.
The article The role of natural gas in setting electricity prices in Europe, published in the Energy Reports journal, states that although in 2021 gas-fired power stations accounted for 43% of electricity generation in the UK, this form of generation set the system price 97% of the time. Therefore, it is the wholesale price of gas that is almost always the main factor in establishing UK electricity prices.
Since 2021, there has been a substantial increase in wholesale gas prices, first because of pressures in international supply chains as the global economy recovered from the coronavirus (COVID-19) pandemic, and then because of the Russian invasion of Ukraine. Wholesale gas prices are determined in international markets and, prior to the Ukrainian crisis, many European Union (EU) countries, especially Germany, could import abundant gas through pipelines from Russia. Although the UK can still import gas through pipelines from Norway, it and the rest of Europe increasingly relies on more expensive Liquified Natural Gas (LNG) from the US, Qatar, and Africa.
Following these marked increases in gas and electricity prices, in 2023, the UK reported the highest electricity prices for industrial users out of 24 countries reporting to the International Energy Association (IEA). The IEA is an organisation where the affiliated countries account for three-quarters of global energy demand. Electricity prices for UK industrial users were almost 50% higher than in France and Germany and four times higher than the United States and Canada. In 2023, UK electricity prices were 46% higher than the IEA median (see Figure 3). Over the last 10 years, UK electricity prices for industrial users have ranged from 17% above to 49% above the IEA median.
High electricity prices for UK industrial users relative to the United States and Canada reflect comparatively high gas prices. However, the same cannot be reasoned for high electricity prices relative to European countries. This gap is more of a reflection of gas prices relative to other forms of electricity generation and the relative reliance on gas-fired power stations.
According to the research published in the article, The role of natural gas in setting electricity prices in Europe, in 2021, natural gas set the marginal price of electricity in the EU only 36% of the time, although there was wide variation around this average. For instance, Italy also relies heavily on gas-fired generation and faces relatively high industrial electricity prices. However, in France and Germany, where the price-setting generators are more often nuclear and coal, respectively, gas-fired power generation sets the marginal electricity price only 7% and 24% of the time.
Research published by the UK regulator Office for Gas and Electricity Markets (OFGEM) in their Research into GB electricity prices for energy intensive industries report (PDF, 857KB) also concludes that high electricity prices for large industrial users are strongly driven by wholesale electricity costs that have been pushed higher by a generation mix that depends on comparatively expensive natural gas at the marginal plant. In part, this reflects the "dash for gas" in the 1990s, when a combination of technological and regulatory changes led to a fast and substantial increase in the number of gas-fired plants in the UK.
It also reflects the impact of the Carbon Price Support, which sets a relatively high minimum price for carbon emissions in the UK. This has been instrumental in decarbonizing power generation using coal. The last remaining coal-fired power station in the UK at Ratcliffe-on-Sour closed in September 2024.
The OFGEM research also identified two further factors resulting in higher electricity prices for UK large industrial users of electricity compared with those in Europe. The first are relative reductions in policy costs. Policy costs are designed to incentivise the use of renewables. In the UK, these include taxes such as Renewables Obligations, Feed-in tariffs and the Climate Change Levy. Although reductions in policy costs are applied to energy-intensive industries (EII) in the UK, these reductions are less generous than those in Germany, France, and the Netherlands.
The second factor is that network costs in Great Britain for EII are also higher because comparator European countries offer discounts to those users that provide a large baseload demand to the electricity grid, which lowers network costs for these users by up to 90%. The rationale for these discounts is that large and stable baseload demand helps lower the costs of balancing demand and supply for electricity in the grid.
Energy-intensive industries in the UK
The input-output supply and use tables (IOSUTs) track the flow of goods and services through the economy and provide a convenient tool for identifying industries in the UK that are relatively energy intensive in terms of their inputs of gas and electricity. These are published annually by the Office for National Statistics (ONS) so allow the structure of production in terms of inputs into each industry and the nature of supply chains between different industries to both be tracked over time. The ONS has recently published an interactive tool based on the IOSUTs that makes it easy for users to explore how a selected product or service is used in the UK economy and how changes in the final demand for that product affects different industries.
The supply and use tables record the inputs of products and services (which are collectively known as intermediate consumption) along with labour and capital used in the production of each industry's total output. This enables the total intermediate consumption of gas and electricity to be calculated as a proportion of total output for each industry. This measure of energy intensity, based on an average over 2017 to 2019, when gas and electricity prices were relatively stable, is used in Table 1 to identify the UK's most energy-intensive industries.
There has been a marked contraction in several of the UK's energy-intensive manufacturing industries since 2021.
For the UK, the real output of the EIIs fell by 33.6% between 2021 Quarter 1 (Jan to Mar) and 2024 Quarter 4 (Oct to Dec). This compares with a smaller fall of 6.2% in other manufactures. Note the output of UK foods and beverages manufacturing, of which several were identified as having high energy input costs, declined by 3% over this period.
Output in other production industries declined by 18.2%, primarily because of a fall in mining and quarrying output as North Sea oil and gas production continues its long-term decline.
Services output, in contrast, increased by 16.4%. This partly reflects the recovery from the coronavirus (COVID-19) pandemic and because of the impact of the third national lockdown suppressing service sector output in 2021 Quarter 1. However, the recovery in output is also reflected in the relatively high energy-intensive service industries identified in Tables 1 and 2, notably hospitality and rail travel.
In Figure 7, the index of production for UK manufacturing EIIs is shown over a longer time series along with an index of production for the remainder of the manufacturing sector. This shows that the UK manufacturing EIIs are relatively cyclical, and that there have been large past declines in output not associated with rising energy prices, such as during the global financial crisis of 2008 to 2009.
Read the full ONS article with more graphs and links HERE