Private rent and house prices, UK: May 2025 - Both Up
21st May 2025
Average UK monthly private rents increased by 7.4%, to £1,335, in the 12 months to April 2025 (provisional estimate); this annual growth rate is down from 7.7% in the 12 months to March 2025.
Average rents increased to £1,390 (7.5%) in England, £795 (8.7%) in Wales, and £999 (5.1%) in Scotland, in the 12 months to April 2025.
In Northern Ireland, average rents increased to £843 (7.8%) in the 12 months to February 2025.
In England, private rents annual inflation was highest in the North East (9.4%) and lowest in Yorkshire and The Humber (4.0%), in the 12 months to April 2025.
Average UK house prices increased by 6.4%, to £271,000, in the 12 months to March 2025 (provisional estimate); this annual growth rate is up from 5.5% in the 12 months to February 2025.
Average house prices increased to £296,000 (6.7%) in England, £208,000 (3.6%) in Wales, and £186,000 (4.6%) in Scotland, in the 12 months to March 2025.
House prices across the UK
The average house price for England was £296,000 in March 2025, up 6.7% (£19,000) from a year earlier. This annual rise was higher than in the 12 months to February 2025 (5.4%).
The average house price for Wales was £208,000 in March 2025, up 3.6% (£7,000) from a year earlier. This annual rise was lower than in the 12 months to February 2025 (4.2%).
The average house price for Scotland was £186,000 in March 2025, up 4.6% (£8,000) from a year earlier. This annual rise was lower than in the 12 months to February 2025 (5.3%).
The average house price for Northern Ireland was £185,000 in Quarter 1 (Jan to Mar) 2025, up 9.5% (£16,000) from Quarter 1 2024.
UK private rent and house prices
Average UK monthly private rents increased by 7.4% in the 12 months to April 2025 (provisional estimate). This was down from 7.7% in the 12 months to March 2025 and was below the record-high annual rise of 9.1% in March 2024.
Average UK house prices increased by 6.4% (provisional estimate), to £271,000, in the 12 months to March 2025. This annual growth was up from 5.5% in the 12 months to February 2025. Annual inflation has been generally increasing since its recent low point of negative 2.7% in the 12 months to December 2023.
On 1 April 2025, Stamp Duty Land Tax (SDLT) rules changed in England and Northern Ireland, increasing the tax payable on properties valued above £125,000 (for non first-time buyers). HM Revenue and Customs (HMRC) reported that sales in England and Northern Ireland in March 2025 were the highest since September 2021 (where increased volumes were also observed ahead of the October 2021 SDLT changes).
The SDLT changes are likely to have increased volumes and prices in areas where average prices are lower. For example, the North East was the English region with the highest house price annual inflation rate (14.3% in the 12 months to March 2025) and monthly inflation rate (4.2% between February 2025 and March 2025), but the lowest average price, at £168,000. This annual rate was up from 8.5% in the 12 months to February 2025 and represents the highest annual growth and monthly growth in the North East since September 2021.
Annual house price inflation was lowest in London, at 0.8% in the 12 months to March 2025. This was down from 1.4% in the 12 months to February 2025.
Private rents across the UK
The average private rent in the UK was £1,335 per month in April 2025. This is £92 (7.4%) higher than the figure 12 months previously.
Table of contents
Main points
UK private rent and house prices
House prices across the UK and by English region
Private rents across the UK
Private rents by English region
Private rents for local areas
Private rents by property size
Data on private rent and house prices
Glossary
Data sources and quality
Related links
Cite this statistical bulletin
Print this Statistical bulletin
Download as PDF
1.Main points
Average UK monthly private rents increased by 7.4%, to £1,335, in the 12 months to April 2025 (provisional estimate); this annual growth rate is down from 7.7% in the 12 months to March 2025.
Average rents increased to £1,390 (7.5%) in England, £795 (8.7%) in Wales, and £999 (5.1%) in Scotland, in the 12 months to April 2025.
In Northern Ireland, average rents increased to £843 (7.8%) in the 12 months to February 2025.
In England, private rents annual inflation was highest in the North East (9.4%) and lowest in Yorkshire and The Humber (4.0%), in the 12 months to April 2025.
Average UK house prices increased by 6.4%, to £271,000, in the 12 months to March 2025 (provisional estimate); this annual growth rate is up from 5.5% in the 12 months to February 2025.
Average house prices increased to £296,000 (6.7%) in England, £208,000 (3.6%) in Wales, and £186,000 (4.6%) in Scotland, in the 12 months to March 2025.
!
The UK House Price Index (HPI) reference period was updated to January 2023 in our February 2025 release. Read more in "UK HPI re-referencing" in Section 10: Data sources and quality.
Since March 2025, the Price Index of Private Rents (PIPR) has incorporated Northern Ireland, enabling us to produce average rent levels for Northern Ireland and for the UK. Read more in Section 10: Data sources and quality.
!
Price Index of Private Rents (PIPR) data are official statistics in development, and we advise caution when using the data. Because of data collection differences, we advise caution when comparing Scotland and Northern Ireland estimates with other UK countries. Read more in Section 10: Data sources and quality.
Back to table of contents
2.UK private rent and house prices
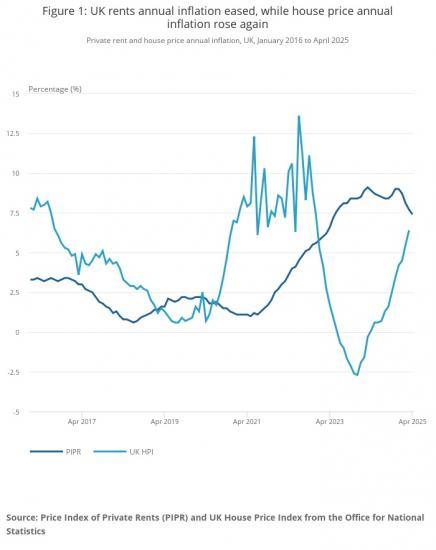
Average UK monthly private rents increased by 7.4% in the 12 months to April 2025 (provisional estimate). This was down from 7.7% in the 12 months to March 2025 and was below the record-high annual rise of 9.1% in March 2024.
Average UK house prices increased by 6.4% (provisional estimate), to £271,000, in the 12 months to March 2025. This annual growth was up from 5.5% in the 12 months to February 2025. Annual inflation has been generally increasing since its recent low point of negative 2.7% in the 12 months to December 2023.
HM Land Registry publishes the full UK House Price Index report and monthly data.
Our Housing prices in your area tool summarises the latest private rents and house price statistics for local areas. In May 2025, this tool's coverage was expanded from Great Britain to the UK.
In 2024, total transaction volumes for UK House Price Index (HPI) first estimates (provisional) returned to target levels, but transaction volumes for older periods and new builds remain lower than historically.
!
Users should be aware that UK HPI revisions may be larger than usual and should note the considerably greater uncertainty around new build prices.
UK monthly rents estimates for the latest two months, and UK HPI estimates for the latest 12 months, are provisional and subject to revision (see Section 10: Data sources and quality). All statistics are non-seasonally adjusted estimates, unless stated otherwise.
Figure 1: UK rents annual inflation eased, while house price annual inflation rose again
Private rent and house price annual inflation, UK, January 2016 to April 2025
PIPRUK HPIApr 2025Apr 2024Apr 2023Apr 2022Apr 2021Apr 2020Apr 2019Apr 2018Apr 2017Apr 2016-5051015Percentage (%)
Apr 2019
● PIPR: 1.6
● UK HPI: 1.3
Source: Price Index of Private Rents (PIPR) and UK House Price Index from the Office for National Statistics
Notes:
Northern Ireland private rents data are currently available up to February 2025. To produce UK rents statistics up to April 2025, Northern Ireland's index for the latest two months has been estimated using the monthly average of Northern Ireland's latest two-month inflation rate.
UK PIPR estimates for March 2025 and April 2025 will be revised in line with PIPR's two-month revision policy. More information is available in Section 10: Data sources and quality.
Download this chartFigure 1: UK rents annual inflation eased, while house price annual inflation rose again
Image .csv .xls
Our How we measure rental price inflation blog post explains the differences between measures of new-let annual inflation and the Price Index of Private Rents (PIPR), which measures the price change of the entire privately rented stock.
The Royal Institution of Chartered Surveyors (RICS) reported that tenant demand increased, and that the decline in new landlord instructions remains an enduring feature of the market. More information is available in the UK Residential Market Survey April 2025 report (PDF 4.8MB).
Back to table of contents
3.House prices across the UK and by English region
The average house price for England was £296,000 in March 2025, up 6.7% (£19,000) from a year earlier. This annual rise was higher than in the 12 months to February 2025 (5.4%).
The average house price for Wales was £208,000 in March 2025, up 3.6% (£7,000) from a year earlier. This annual rise was lower than in the 12 months to February 2025 (4.2%).
The average house price for Scotland was £186,000 in March 2025, up 4.6% (£8,000) from a year earlier. This annual rise was lower than in the 12 months to February 2025 (5.3%).
The average house price for Northern Ireland was £185,000 in Quarter 1 (Jan to Mar) 2025, up 9.5% (£16,000) from Quarter 1 2024.
Figure 2: Annual house price inflation is highest in the North East
Annual house price inflation, English regions, March 2025
North EastYorkshire and The HumberNorth WestWest Midlands RegionEast MidlandsEnglandEast of EnglandSouth EastSouth WestLondon0246810121416Percentage (%)
London
● Annual percentage change: 0.8
Source: UK House Price Index from the Office for National Statistics
Notes:
Estimates are not seasonally adjusted.
Download this chartFigure 2: Annual house price inflation is highest in the North East
Image .csv .xls
On 1 April 2025, Stamp Duty Land Tax (SDLT) rules changed in England and Northern Ireland, increasing the tax payable on properties valued above £125,000 (for non first-time buyers). HM Revenue and Customs (HMRC) reported that sales in England and Northern Ireland in March 2025 were the highest since September 2021 (where increased volumes were also observed ahead of the October 2021 SDLT changes).
The SDLT changes are likely to have increased volumes and prices in areas where average prices are lower. For example, the North East was the English region with the highest house price annual inflation rate (14.3% in the 12 months to March 2025) and monthly inflation rate (4.2% between February 2025 and March 2025), but the lowest average price, at £168,000. This annual rate was up from 8.5% in the 12 months to February 2025 and represents the highest annual growth and monthly growth in the North East since September 2021.
Annual house price inflation was lowest in London, at 0.8% in the 12 months to March 2025. This was down from 1.4% in the 12 months to February 2025.
Back to table of contents
4.Private rents across the UK
The average private rent in the UK was £1,335 per month in April 2025. This is £92 (7.4%) higher than the figure 12 months previously.
Figure 3: The average rent in the UK was £1,335 in April 2025
Average private rent, UK overview and across the UK, January 2015 to April 2025
Embed code
Notes
Northern Ireland private rents data are currently available up to February 2025. To produce UK rents statistics up to April 2025, Northern Ireland's index for the latest two months has been estimated using the monthly average of Northern Ireland's latest two-month inflation rate.
UK PIPR estimates for March 2025 and April 2025 will be revised in line with PIPR's two-month revision policy. More information is available in Section 10: Data sources and quality.
Northern Ireland rents data are for advertised new lets.
Because of data collection limitations, Scotland rents data (used in the PIPR) are mainly for advertised new lets (see Section 10: Data sources and quality. Users should bear this in mind when comparing across the UK.
England
Average rent for England was £1,390 in April 2025, up 7.5% (£97) from a year earlier. This annual rise was lower than in the 12 months to March 2025 (7.8%) and below the record-high annual growth in the 12 months to November 2024 (9.2%).
Wales
Average rent for Wales was £795 in April 2025, up 8.7% (£64) from a year earlier. This annual rise was lower than in the 12 months to March 2025 (8.9%), but below the record-high annual rise of 9.9% in November 2023.
Scotland
Average rent for Scotland was £999 in April 2025, up 5.1% (£48) from a year earlier. This annual rise was lower than in the 12 months to March 2025 (5.7%). Scotland's annual inflation rate has been generally slowing since the record-high annual rise of 11.7% in August 2023. Recent monthly price falls in Lothian were the biggest contributor to the small decrease in Scotland's average rent price between March and April 2025.
Because of data collection limitations, Scotland rents data, which are used in the Price Index of Private Rents (PIPR) stock measure, are mainly for advertised new lets. From September 2022 to March 2025, measures relating to in-tenancy rent increases were implemented in Scotland (see Section 10: Data sources and quality). We advise users to bear this in mind when interpreting estimates for Scotland and comparing with other UK countries.
Northern Ireland
We incorporated Northern Ireland into the PIPR in March 2025, enabling us to produce average rent levels for Northern Ireland and for the UK.
Average rent in Northern Ireland was £843 in February 2025, up 7.8% (£61) from a year earlier. This annual rise was lower than in the 12 months to January 2025 (8.2%). Northern Ireland's annual inflation rate has been generally slowing since the record-high annual rise of 9.9% in April 2024.
Private rents by property size
The average UK monthly private rent in April 2025 was highest for detached properties (£1,524) and lowest for flats and maisonettes (£1,309). Average UK private rent was highest for properties with four or more bedrooms (£2,001) and lowest for properties with one bedroom (£1,082).
[url=https://www.ons.gov.uk/economy/inflationandpriceindices/bulletins/privaterentandhousepricesuk/may2025]For more data, grphs and maps Read the full ONS report HERE[/url]