GDP first quarterly estimate UK - April to June 2025 - Rise 0.3%
14th August 2025
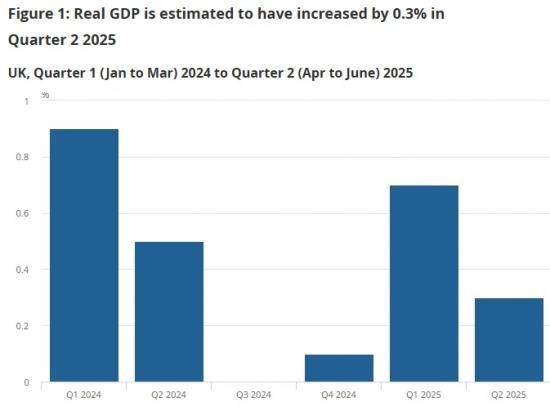
UK gross domestic product (GDP) is estimated to have increased by 0.3% in Quarter 2 (Apr to June) 2025, following an increase of 0.7% in Quarter 1 (Jan to Mar) 2025.
GDP is estimated to have increased by 1.2% in Quarter 2 2025, compared with the same quarter a year ago.
In output terms, growth in the latest quarter was driven by increases of 0.4% in services and 1.2% in construction; while the production sector fell by 0.3%.
Real GDP per head is estimated to have grown by 0.2% in the latest quarter and is up 0.7% compared with the same quarter a year ago.
Headline GDP figures
UK real gross domestic product (GDP) is estimated to have increased by 0.3% in Quarter 2 (Apr to June) 2025. This shows slowed growth, following growth of 0.7% in the previous quarter (Figure 1). Some activity was brought forward to February and March ahead of changes to stamp duty in April and announced US tariff changes. Monthly GDP is estimated to have grown by 0.4% in June 2025, with growth in all three sectors, as shown in our GDP monthly estimate, UK: June 2025 bulletin. This follows an unrevised fall of 0.1% in May 2025 and an upwardly revised fall of 0.1% in April 2025 (previously a 0.3% fall).
Nominal GDP is estimated to have increased by 0.8% in Quarter 2 2025, and is now 5.3% higher compared with the same quarter a year ago.
The implied GDP deflator is the broadest measure of inflation in the domestic economy, reflecting changes in the price of all goods and services that make up GDP. The GDP deflator covers the whole of the domestic economy, not just consumer spending. It also reflects the change in the relative price of exports to imports.
Real GDP is estimated to have increased by 1.2%, compared with the same quarter a year ago.
Output
Output is estimated to have grown by 0.3% in Quarter 2 (Apr to June) 2025. This shows slowed growth, following growth of 0.7% in the previous quarter. Some activity was brought forward to February and March ahead of changes to stamp duty in April and announced US tariff changes. Overall, 11 out of 20 of the subsectors increased, with the services sector growing by 0.4%. Construction output increased by 1.2%, while production fell by 0.3%.
Services
Services output increased by 0.4% in the latest quarter, following growth of 0.7% in the previous quarter. Services output is estimated to be 1.2% higher, compared with the same quarter a year ago. Non-consumer-facing services (business-facing services) increased by 0.4% in Quarter 2 2025, while consumer-facing services increased by 0.3%.
Figure 3 shows 8 of the 14 services sectors contributed positively to growth. The largest positive contributor to growth was information and communication, which increased by 2.0%. Within this subsector, the largest contributor was from computer programming, consultancy and related activities, which grew by 4.1%.
The second largest positive contribution to growth was human health and social work activities, which increased by 1.1%. This was mainly because of non-market health, which is discussed further in the expenditure section.
The largest negative contributor to growth in Quarter 2 2025 was wholesale and retail trade; repair of motor vehicles and motorcycles, which fell by 0.9%. This was mainly because of a decline in wholesale trade, excluding motor vehicles and motorcycles, which fell by 2.4%.
Production
The production sector is estimated to have fallen by 0.3% in the latest quarter, following a 1.3% increase in Quarter 1 (Jan to Mar) 2025. Production output is estimated to be 0.3% higher, compared with the same quarter a year ago.
The fall in production in Quarter 2 2025 was caused by declines of 6.8% in electricity, gas, steam and air conditioning supply, and 0.3% in mining and quarrying. Elsewhere, there was an increase of 2.1% in water supply; sewerage, and waste management and remediation activities.
In addition, manufacturing output grew by 0.3% in Quarter 2 2025, following growth of 1.1% in Quarter 1 2025, and is now 1.0% higher, compared with the same quarter a year ago. Figure 4 shows there were increases in 5 out of 13 manufacturing subsectors in the latest quarter. The largest positive contributions were from the manufacture of pharmaceuticals, which grew by 7.0%, and the manufacture of machinery and equipment, which grew by 3.0%.
Construction
Construction output is estimated to have grown by 1.2% in Quarter 2 2025, compared with 0.3% in Quarter 1. This is 2.2% higher than the same quarter a year ago. New work increased by 1.1% over the period, and repair and maintenance grew by 1.4%. Within new work, the largest positive contributor came from infrastructure new work, which grew by 3.2%. In repair and maintenance (R&M) the largest positive contributor came from private housing R&M, which grew by 3.3%.
Household final consumption expenditure
There was an increase of 0.1% in real household final consumption expenditure in Quarter 2 (Apr to June) 2025 and it is now 1.1% higher compared with the same quarter a year ago. Within household consumption, growth was driven by miscellaneous goods and services, transport, clothing and footwear and housing.
Net tourism contributed negatively to growth in household consumption in the latest quarter. Net tourism is offset within trade, so there is no impact on the GDP aggregate.
Consumption of government goods and services
Real government consumption expenditure grew by 1.2% in the latest quarter and is 1.7% higher, compared with the same quarter a year ago. The growth in government consumption in the latest quarter mainly reflects higher expenditure on health (in particular on vaccinations) and public administration and defence.
Gross capital formation
Within gross capital formation, early estimates of gross fixed capital formation (GFCF) showed a 1.1% fall in Quarter 2 2025, following a 2.0% increase in the previous quarter. GFCF is now up 1.3% compared with the same quarter a year ago. The fall in the latest quarter was mainly driven by transport, as well as declines in other machinery and equipment, and other buildings and structures.
Within GFCF, business investment is estimated to have fallen by 4.0% in Quarter 2 2025, following a 3.9% increase in the previous quarter.
Excluding the alignment adjustments, early estimates show that real inventories increased by £3.6 billion in Quarter 2 2025, which is less than the £7.0 billion increase in inventories seen in the first quarter of 2025 (Table 2). This was driven by higher stocks in manufacturing, specifically work in progress, and material, stores and fuel inventories.
Net trade
The UK's trade deficit for goods and services was 1.9% of nominal GDP in Quarter 2 2025. However, this includes non-monetary gold and other precious metals, which is an erratic series. It can be useful to exclude this from the trade balance. Excluding non-monetary gold and other precious metals, the trade deficit was 1.2% of nominal GDP in Quarter 2 2025.
HM Revenue and Customs (HMRC) have made revisions to imports and exports of Chapter 84 Mechanical Appliances from August 2024 to May 2025, following an in-depth quality assurance review.
Read the full ONS report HERE