Consumer price inflation UK July 2025 Slight Rise To 4.2% Well Above Bank of England 2% Target
20th August 2025
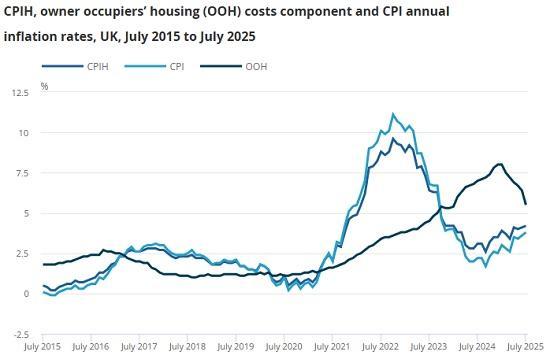
The Consumer Prices Index including owner occupiers' housing costs (CPIH) rose by 4.2% in the 12 months to July 2025, up from 4.1% in the 12 months to June.
On a monthly basis, CPIH was little changed in July 2025, the same as in July 2024.
The Consumer Prices Index (CPI) rose by 3.8% in the 12 months to July 2025, up from 3.6% in the 12 months to June.
On a monthly basis, CPI rose by 0.1% in July 2025, compared with a fall of 0.2% in July 2024.
Transport, particularly air fares, made the largest upward contribution to the monthly change in both CPIH and CPI annual rates; housing and household services, particularly owner occupiers' housing costs, made a large, partially offsetting, downward contribution in CPIH.
Core CPIH (CPIH excluding energy, food, alcohol and tobacco) rose by 4.2% in the 12 months to July 2025, down slightly from 4.3% in the 12 months to June; the CPIH goods annual rate rose from 2.4% to 2.7%, while the CPIH services annual rate was unchanged at 5.2%.
Core CPI (CPI excluding energy, food, alcohol and tobacco) rose by 3.8% in the 12 months to July 2025, up slightly from 3.7% in the 12 months to June; the CPI goods annual rate rose from 2.4% to 2.7%, while the CPI services annual rate rose from 4.7% to 5.0%.
We have identified a minor error in the imputation of missing seasonal item indices. This error has no impact on headline CPI or CPIH annual and monthly growth rates. The Retail Prices Index (RPI) is also unaffected.
The Consumer Prices Index including owner occupiers' housing costs (CPIH) rose by 4.2% in the 12 months to July 2025, up from 4.1% in the 12 months to June (Figure 1).
On a monthly basis, CPIH was little changed in July 2025, the same as in July 2024.
The owner occupiers' housing (OOH) costs component of CPIH rose by 5.5% in the 12 months to July 2025. This is down from 6.4% in the 12 months to June, returning to the levels seen in late 2023 and early 2024. OOH costs fell by 0.1% on the month, compared with a 0.6% increase a year earlier.
The Consumer Prices Index (CPI) rose by 3.8% in the 12 months to July 2025, up from 3.6% in the 12 months to June. The July 2025 figure was the highest recorded since January 2024, when the rate was 4.0%.
On a monthly basis, CPI rose by 0.1% in July 2025, compared with a fall of 0.2% in July 2024.
The main drivers of the annual inflation rate for CPIH and CPI are the same where they are common to both measures. However, the OOH costs component accounts for approximately 17% of the CPIH and is the main driver for differences between the CPIH and CPI inflation rates. This makes CPIH our most comprehensive measure of inflation.
The slight increase in the rate into July 2025 reflected upward contributions from four divisions, partially offset by downward contributions from six divisions. The largest upward contribution came from transport, particularly air fares. This was partially offset by a large downward contribution from housing and household services, particularly owner occupiers' housing costs.
Transport
Prices in the transport division rose overall by 3.2% in the 12 months to July 2025, up from 1.7% in the 12 months to June (Figure 3). On a monthly basis, prices rose by 2.2% in July 2025, compared with a rise of 0.7% a year ago.
The rise in the annual rate reflected a large upward effect from airfares which rose by 30.2% between June and July 2025, compared with a rise of 13.3% between the same months in 2024. The monthly rise in July 2025 is the largest July increase since collection of airfares changed from quarterly to monthly in 2001 and was probably influenced by the timing of school summer holidays. Returning European flights were during the school term in 2024, whereas returning European flights were during the school holidays in 2025, which may have made these flights more expensive.
The rise in the annual rate also reflected a large upward effect from motor fuels. The average price of petrol rose by 2.0 pence per litre between June and July 2025, compared with a fall of 1.4 pence per litre between June and July 2024. The average price stood at 133.9 pence per litre in June 2025, down from 144.4 pence per litre a year earlier.
Similarly, diesel prices rose by 2.9 pence per litre in July 2025, compared with a fall of 1.1 pence per litre in July 2024. The average price stood at 141.4 pence per litre in June 2025, down from 150.4 pence per litre a year earlier. These movements resulted in overall motor fuel prices falling by 6.7% in the 12 months to July 2025, compared with a larger fall of 9.0% in the 12 months to June.
There were also upward effects from sea fares and from roadside recovery services.
Restaurants and hotels
Prices in the restaurants and hotels division rose overall by 3.4% in the 12 months to July 2025, up from 2.6% in the 12 months to June. On a monthly basis, prices rose by 0.4% in July 2025, compared with a fall of 0.4% a year ago.
The largest upward effect came from accommodation services, specifically from overnight hotel stays booked the night before. There were smaller upward effects from restaurants and cafes, and from canteens.
Food and non-alcoholic beverages
The 12-month inflation rate for food and non-alcoholic beverages was 4.9% in July 2025, up from 4.5% in the 12 months to June. This was the fourth consecutive increase in the annual rate and the highest recorded since February 2024, but remains well below the peak seen in early 2023 (Figure 4). On a monthly basis, food and non-alcoholic beverages prices rose by 0.4% in July 2025, compared with being little changed a year ago.
There were small upward effects to the change in the rate from 4 of the 11 food and non-alcoholic beverages classes, these being meat (mainly beef); sugar, jam, honey, syrups, chocolate and confectionery (mainly chocolate assortments); coffee, tea and cocoa (mainly instant coffee); and mineral waters, soft drinks and juices (mainly fresh orange juice).
Housing and household services
The main counteracting downward effect came from the housing and household services division. The 12-month inflation rate for housing and household services was 6.2% in July 2025, down from 6.7% in June. On a monthly basis, prices fell by 0.4% in July 2025, compared with a rise of 0.1% a year ago.
The easing in the 12-month rate between June and July 2025 mainly reflected a downward effect from owner occupiers' housing (OOH) costs, which rose by 5.5% in the 12 months to July 2025 compared with a rise of 6.4% in June 2025. On a monthly basis, OOH costs fell by 0.1% in July 2025 compared with a rise of 0.6% a year ago. This was the first monthly fall in OOH costs since March 2010.
There was also a downward effect from rents, which rose by 4.5% in the 12 months to July 2025, compared with a rise of 5.8% in June 2025. This was the lowest annual growth for rents since October 2022. On a monthly basis, rents rose by 0.4% in July 2025, compared with a rise of 1.7% a year ago.
There was a counteracting upward effect from electricity, where prices rose by 8.0% in the 12 months to July 2025 compared with a rise of 4.5% in June 2025. Monthly electricity prices fell by 3.8% compared with a fall of 6.8% a year ago. This resulted from a change in the Office of Gas and Electricity Markets (Ofgem) energy price cap in July 2025, described on the Ofgem website. Ofgem estimated that for an average household paying by direct debit for dual fuel, this equates to an annual bill of £1,720, a fall of £129.
Read the full ONS report HERE