Consumer price inflation, UK September 2025 No Change 3.8%
22nd October 2025
The Consumer Prices Index including owner occupiers' housing costs (CPIH) rose by 4.1% in the 12 months to September 2025, unchanged from August.
On a monthly basis, CPIH rose by 0.1% in September 2025, the same rate as in September 2024.
The Consumer Prices Index (CPI) rose by 3.8% in the 12 months to September 2025, unchanged from August.
On a monthly basis, CPI was unchanged in September 2025, as in September 2024.
Transport made the largest upward contribution to the monthly change in both CPIH and CPI annual rates; recreation and culture, and food and non-alcoholic beverages made the largest offsetting downward contributions.
Core CPIH (CPIH excluding energy, food, alcohol and tobacco) rose by 3.9% in the 12 months to September 2025, down from 4.0% in the 12 months to August; the CPIH goods annual rate rose slightly from 2.8% to 2.9%, while the CPIH services annual rate was unchanged in September, at 4.9%.
Core CPI (CPI excluding energy, food, alcohol and tobacco) rose by 3.5% in the 12 months to September 2025, down from 3.6% in the 12 months to August; the CPI goods annual rate rose slightly from 2.8% to 2.9%, while the CPI services annual rate was unchanged in September, at 4.7%.
The Consumer Prices Index including owner occupiers' housing costs (CPIH) rose by 4.1% in the 12 months to September 2025, unchanged from August (Figure 1).
On a monthly basis, CPIH rose by 0.1% in September 2025, the same rate as in September 2024.
The Consumer Prices Index (CPI) rose by 3.8% in the 12 months to September 2025, unchanged from August. The September, August and July 2025 figures were the joint-highest recorded since January 2024, when the rate was 4.0%.
On a monthly basis, CPI was unchanged in September 2025, as in September 2024.
The main drivers of the annual inflation rate for CPIH and CPI are the same where they are common to both measures. However, the OOH costs component accounts for approximately 17% of the CPIH and is the main driver for differences between the CPIH and CPI inflation rates.
Table of contents
Main points
Consumer price inflation rates
Notable movements in prices
Latest movements in CPIH inflation
Latest movements in CPI inflation
Data on consumer price inflation
Glossary
Data sources and quality
Related links
Cite this statistical bulletin
Print this Statistical bulletin
Download as PDF
1.Main points
The Consumer Prices Index including owner occupiers' housing costs (CPIH) rose by 4.1% in the 12 months to September 2025, unchanged from August.
On a monthly basis, CPIH rose by 0.1% in September 2025, the same rate as in September 2024.
The Consumer Prices Index (CPI) rose by 3.8% in the 12 months to September 2025, unchanged from August.
On a monthly basis, CPI was unchanged in September 2025, as in September 2024.
Transport made the largest upward contribution to the monthly change in both CPIH and CPI annual rates; recreation and culture, and food and non-alcoholic beverages made the largest offsetting downward contributions.
Core CPIH (CPIH excluding energy, food, alcohol and tobacco) rose by 3.9% in the 12 months to September 2025, down from 4.0% in the 12 months to August; the CPIH goods annual rate rose slightly from 2.8% to 2.9%, while the CPIH services annual rate was unchanged in September, at 4.9%.
Core CPI (CPI excluding energy, food, alcohol and tobacco) rose by 3.5% in the 12 months to September 2025, down from 3.6% in the 12 months to August; the CPI goods annual rate rose slightly from 2.8% to 2.9%, while the CPI services annual rate was unchanged in September, at 4.7%.
Back to table of contents
2.Consumer price inflation rates
Table 1: CPIH, OOH component and CPI index values, and annual and monthly rates
UK, September 2024 to September 2025
CPIH
Index
(UK,
2015
= 100) CPIH
12-
month
rate
(%) CPIH
1- month
rate
(%) CPI
Index
(UK,
2015=
100) CPI 12-
month
rate (%) CPI 1-
month
rate (%) OOH
Index
(UK,
2015=
100) OOH 12-
month
rate (%)
2024 Sep 133.5 2.6 0.1 134.2 1.7 0.0 128.5 7.2
Oct 134.3 3.2 0.6 135.0 2.3 0.6 129.5 7.4
Nov 134.6 3.5 0.2 135.1 2.6 0.1 130.5 7.8
Dec 135.1 3.5 0.3 135.6 2.5 0.3 131.3 8.0
2025 Jan 135.1 3.9 0.0 135.4 3.0 -0.1 131.8 8.0
Feb 135.6 3.7 0.4 136.0 2.8 0.4 132.4 7.5
Mar 136.1 3.4 0.3 136.5 2.6 0.3 132.9 7.2
Apr 137.7 4.1 1.2 138.2 3.5 1.2 133.2 6.9
May 138.0 4.0 0.2 138.4 3.4 0.2 133.7 6.7
Jun 138.4 4.1 0.3 138.9 3.6 0.3 134.2 6.4
Jul 138.5 4.2 0.0 139.0 3.8 0.1 134.0 5.5
Aug 138.9 4.1 0.3 139.3 3.8 0.3 134.5 5.3
Sep 138.9 4.1 0.1 139.3 3.8 0.0 135.1 5.2
Source: Consumer price inflation from the Office for National Statistics
Download this tableTable 1: CPIH, OOH component and CPI index values, and annual and monthly rates
.xls .csv
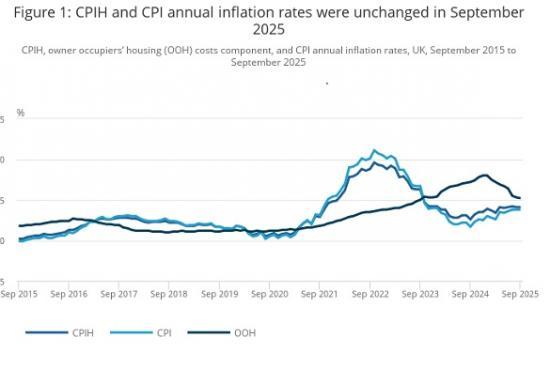
Figure 1: CPIH and CPI annual inflation rates were unchanged in September 2025
CPIH, owner occupiers' housing (OOH) costs component, and CPI annual inflation rates, UK, September 2015 to September 2025
CPIHCPIOOHSep 2025Sep 2024Sep 2023Sep 2022Sep 2021Sep 2020Sep 2019Sep 2018Sep 2017Sep 2016Sep 2015-2.502.557.51012.5%
Aug 2022
● CPIH: 8.6
● CPI: 9.9
● OOH: 3.5
Source: Consumer price inflation from the Office for National Statistics
Download this chartFigure 1: CPIH and CPI annual inflation rates were unchanged in September 2025
Image .csv .xls
The Consumer Prices Index including owner occupiers' housing costs (CPIH) rose by 4.1% in the 12 months to September 2025, unchanged from August (Figure 1).
On a monthly basis, CPIH rose by 0.1% in September 2025, the same rate as in September 2024.
The Consumer Prices Index (CPI) rose by 3.8% in the 12 months to September 2025, unchanged from August. The September, August and July 2025 figures were the joint-highest recorded since January 2024, when the rate was 4.0%.
On a monthly basis, CPI was unchanged in September 2025, as in September 2024.
The main drivers of the annual inflation rate for CPIH and CPI are the same where they are common to both measures. However, the OOH costs component accounts for approximately 17% of the CPIH and is the main driver for differences between the CPIH and CPI inflation rates. This makes CPIH our most comprehensive measure of inflation. We cover this in more detail in Section 4: Latest movements in CPIH inflation and provide a commentary on CPI in Section 5: Latest movements in CPI inflation. We also cover both CPIH and CPI in Section 3: Notable movements in prices, though the figures reflect CPIH.
Back to table of contents
3.Notable movements in prices
Table 2: CPIH annual and monthly inflation rates by division
UK, September 2024, August 2025, and September 2025
CPIH 12-month rate (%) CPIH 1-month rate (%)
August 2025 September 2025 September 2024 September 2025
CPIH All items 4.1 4.1 0.1 0.1
Food and non-alcoholic
beverages 5.1 4.5 0.4 -0.2
Alcohol and tobacco 5.9 5.8 0.1 0.0
Clothing and footwear 0.2 0.5 2.1 2.4
Housing and
household services 6.0 5.9 0.4 0.3
of which owner occupiers'
housing costs 5.3 5.2 0.6 0.5
Furniture and household goods 0.8 0.4 0.4 0.0
Health 3.4 3.5 0.2 0.2
Transport 2.4 3.8 -3.7 -2.3
Communication 6.1 4.7 1.0 -0.3
Recreation and culture 3.2 2.7 0.5 0.0
Education 7.5 7.2 1.8 1.5
Restaurants and hotels 3.8 3.9 0.6 0.8
Miscellaneous goods
and services 2.3 2.0 0.2 -0.1
All goods 2.8 2.9 0.2 0.2
All services 4.9 4.9 0.0 -0.1
CPIH exc food, energy, alcohol
and tobacco (core CPIH) 4.0 3.9 0.2 0.1
Source: Consumer price inflation from the Office for National Statistics
Download this tableTable 2: CPIH annual and monthly inflation rates by division
.xls .csv
Figure 2: Transport led upward contributions to the change in CPIH annual inflation
Contributions to change in the CPIH annual inflation rate, UK, between August and September 2025
TransportClothing and footwearRestaurants and hotelsEducationHealthAlcohol and tobaccoMiscellaneous goods and servicesFurniture and household goodsCommunicationHousing and household servicesof which owner occupiers housing costsFood and non-alcoholic beveragesRecreation and culture-0.0500.050.10.15-0.10.2Percentage points
Source: Consumer price inflation from the Office for National Statistics
Notes:
Individual contributions may not sum to the total because of rounding.
More information on the contents of each division can be found in Table 3 of our accompanying Consumer price inflation dataset.
Download this chartFigure 2: Transport led upward contributions to the change in CPIH annual inflation
Image .csv .xls
Figure 2 shows the contributions from the 12 divisions to the change in the annual Consumer Prices Index including owner occupiers' housing costs (CPIH) inflation rate between August and September 2025. These sum to the change in the annual rate between the latest two months, which was 0.0 percentage points.
The unchanged rate in September 2025 reflected upward contributions from three divisions, offset by downward contributions from six divisions. The largest upward contribution was from the transport division. The largest offsetting downward contributions came from the recreation and culture, food and non-alcoholic beverages, and housing and household services divisions.
Transport
Prices in the transport division rose overall by 3.8% in the 12 months to September 2025, up from 2.4% in the 12 months to August (Figure 3). On a monthly basis, prices fell by 2.3% in September 2025, compared with a fall of 3.7% a year ago.
The increase in the annual rate reflected upward effects from motor fuels, air fares and, to a lesser extent, vehicle maintenance and repair.
The average price of petrol fell by 0.2 pence per litre between August and September 2025, compared with a fall of 5.5 pence per litre between August and September 2024. The average price stood at 134.0 pence per litre in September 2025, down from 136.8 pence per litre a year earlier.
Similarly, diesel prices fell by 0.4 pence per litre in September 2025, compared with a fall of 6.0 pence per litre in September 2024. The average price stood at 141.8 pence per litre in September 2025, unchanged from a year earlier. These movements resulted in overall motor fuel prices falling by 1.2% in the 12 months to September 2025, compared with a larger fall of 4.9% in the 12 months to August.
Air fares fell by 28.8% between August and September 2025, which was the third-largest September decrease since the collection of airfares changed from quarterly to monthly in 2001. However, air fares fell by 34.8% between August and September 2024, which was the largest September decrease since 2001. As such, the large fall in monthly price in September 2025 still resulted in an upward contribution to the change in the annual rate.
Prices for vehicle maintenance and repair rose this year but fell a year ago, particularly for roadside recovery services, which also resulted in an upward effect.
Recreation and culture
The 12-month inflation rate for recreation and culture was 2.7% in September 2025, down from 3.2% in August. On a monthly basis, prices were little changed in September 2025, compared with a rise of 0.5% a year ago.
The largest downward effect came from live music, where monthly prices fell by 8.6% compared with a rise of 5.8% a year ago.
Food and non-alcoholic beverages
The 12-month inflation rate for food and non-alcoholic beverages was 4.5% in September 2025, down from 5.1% in August. This was the first time since March 2025 that the annual rate has slowed (Figure 4). On a monthly basis, food and non-alcoholic beverages prices fell by 0.2% in September 2025, compared with a rise of 0.4% a year ago. This was the first time since May 2024 that prices have fallen on the month.
There were small downward effects to the change in the rate from 5 of the 11 food and non-alcoholic beverages classes, namely:
vegetables
milk, cheese and eggs (particularly cheese)
bread and cereals
fish
mineral waters, soft drinks, and juices
The negative contribution from the food and non-alcoholic beverages division seems likely to have been caused in part by sales and discounting increasing at a greater rate into September 2025 than into September 2024.
Housing and household services
The 12-month inflation rate for housing and household services was 5.9% in September 2025, down from 6.0% in August. On a monthly basis, prices rose by 0.3% in September 2025, compared with a rise of 0.4% a year ago.
The easing in the 12-month rate between August and September 2025 mainly reflected a downward effect from owner occupiers' housing (OOH) costs, which rose by 5.2% in the 12 months to September 2025, compared with a rise of 5.3% in the 12 months to August 2025. The rate has slowed for eight consecutive months and is the lowest recorded since September 2023, when it was 5.0%. OOH costs rose by 0.5% on the month, compared with a 0.6% increase a year earlier.
Read the full ONS report HERE