Consumer Price Inflation UK: January 2026 Fall To 3%
18th February 2026
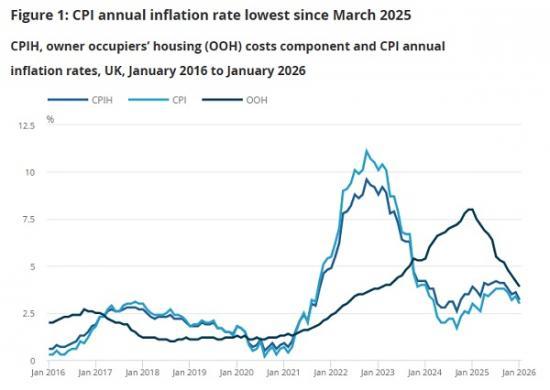
UK CPI (Consumer Prices Index) rose by 3.0% in the 12 months to January 2026, down from 3.4% in December 2025.
This is the lowest annual CPI inflation rate since March 2025.
Broader Inflation Measure (CPIH)
CPIH (which includes owner occupiers' housing costs) rose by 3.2% in the year to January 2026, down from 3.6% in December 2025.
Monthly Changes
On a monthly basis, CPI fell by 0.5% in January 2026 (following a 0.4% fall in CPIH).
Price Movement Drivers
The largest downward contributions to the change in inflation came from:
Transport (notably lower motor fuel prices), and
Food and non-alcoholic beverages, both of which rose less than in the previous year.
Other categories like housing and household services also contributed to the fall in the inflation rate.
Core Inflation
Core measures (excluding energy, food, alcohol and tobacco) also eased compared with December:
Core CPIH fell slightly to 3.3%,
Core CPI eased to 3.1%.
Context
The overall picture points to easing price pressures compared with late 2025, driven by slower increases in key spending categories.
The Consumer Prices Index including owner occupiers' housing costs (CPIH) rose by 3.2% in the 12 months to January 2026, down from 3.6% in the 12 months to December 2025.
On a monthly basis, CPIH fell by 0.3% in January 2026, while it was little changed in January 2025.
The Consumer Prices Index (CPI) rose by 3.0% in the 12 months to January 2026, down from 3.4% in the 12 months to December 2025.
On a monthly basis, CPI fell by 0.5% in January 2026, compared with a fall of 0.1% in January 2025.
Transport, and food and non-alcoholic beverages made the largest downward contributions to the monthly change in both CPIH and CPI annual rates.
Core CPIH (CPIH excluding energy, food, alcohol and tobacco) rose by 3.3% in the 12 months to January 2026, down from 3.5% in the 12 months to December 2025; the CPIH goods annual rate fell from 2.2% to 1.6%, while the CPIH services annual rate fell from 4.5% to 4.3%.
Core CPI (CPI excluding energy, food, alcohol and tobacco) rose by 3.1% in the 12 months to January 2026, down from 3.2% in the 12 months to December 2025; the CPI goods annual rate fell from 2.2% to 1.6%, while the CPI services annual rate fell from 4.5% to 4.4%.
The Consumer Prices Index including owner occupiers' housing costs (CPIH) rose by 3.2% in the 12 months to January 2026, down from 3.6% in the 12 months to December 2025 (Figure 1).
On a monthly basis, CPIH fell by 0.3% in January 2026, while it was little changed in January 2025.
The Consumer Prices Index (CPI) rose by 3.0% in the 12 months to January 2026, down from 3.4% in the 12 months to December 2025.
On a monthly basis, CPI fell by 0.5% in January 2026, compared with a fall of 0.1% in January 2025.
The main drivers of the annual inflation rate for CPIH and CPI are the same where they are common to both measures. However, the OOH costs component accounts for approximately 18% of the CPIH and is the main driver for differences between the CPIH and CPI inflation rates.
Transport
Prices in the transport division rose overall by 2.7% in the 12 months to January 2026, down from 4.0% in the 12 months to December. On a monthly basis, prices fell by 1.8% in January 2026, compared with a fall of 0.5% a year ago.
The largest downward effect came from motor fuels, where the average price of petrol fell by 3.1 pence per litre between December 2025 and January 2026, compared with a rise of 0.8 pence per litre between December 2024 and January 2025. The average price stood at 133.2 pence per litre in January 2026, down from 137.1 pence per litre a year earlier.
Similarly, diesel prices fell by 3.2 pence per litre in January 2026, compared with a rise of 1.5 pence per litre in January 2025. The average price stood at 142.5 pence per litre in January 2026, up from 144.1 pence per litre a year earlier. These movements resulted in overall motor fuel prices falling by 2.2% in the 12 months to January 2026, compared with a rise of 0.9% in the 12 months to December 2025.
Table of contents
Main points
Consumer price inflation rates
Notable movements in prices
Latest movements in CPIH inflation
Latest movements in CPI inflation
Data on consumer price inflation
Glossary
Data sources and quality
Related links
Cite this statistical bulletin
Print this Statistical bulletin
Download as PDF
1.Main points
The Consumer Prices Index including owner occupiers' housing costs (CPIH) rose by 3.2% in the 12 months to January 2026, down from 3.6% in the 12 months to December 2025.
On a monthly basis, CPIH fell by 0.3% in January 2026, while it was little changed in January 2025.
The Consumer Prices Index (CPI) rose by 3.0% in the 12 months to January 2026, down from 3.4% in the 12 months to December 2025.
On a monthly basis, CPI fell by 0.5% in January 2026, compared with a fall of 0.1% in January 2025.
Transport, and food and non-alcoholic beverages made the largest downward contributions to the monthly change in both CPIH and CPI annual rates.
Core CPIH (CPIH excluding energy, food, alcohol and tobacco) rose by 3.3% in the 12 months to January 2026, down from 3.5% in the 12 months to December 2025; the CPIH goods annual rate fell from 2.2% to 1.6%, while the CPIH services annual rate fell from 4.5% to 4.3%.
Core CPI (CPI excluding energy, food, alcohol and tobacco) rose by 3.1% in the 12 months to January 2026, down from 3.2% in the 12 months to December 2025; the CPI goods annual rate fell from 2.2% to 1.6%, while the CPI services annual rate fell from 4.5% to 4.4%.
Back to table of contents
2.Consumer price inflation rates
Table 1: CPIH, OOH component and CPI index values, and annual and monthly rates
UK, January 2025 to January 2026
CPIH Index
(UK, 2015 = 100) CPIH 12-
month rate (%) CPIH 1-
month rate (%) CPI Index
(UK, 2015=100) CPI 12-
month rate (%) CPI 1-
month rate (%) OOH Index
(UK, 2015=100) OOH 12-
month rate (%)
2025 Jan 135.1 3.9 0.0 135.4 3.0 -0.1 131.8 8.0
Feb 135.6 3.7 0.4 136.0 2.8 0.4 132.4 7.5
Mar 136.1 3.4 0.3 136.5 2.6 0.3 132.9 7.2
Apr 137.7 4.1 1.2 138.2 3.5 1.2 133.2 6.9
May 138.0 4.0 0.2 138.4 3.4 0.2 133.7 6.7
Jun 138.4 4.1 0.3 138.9 3.6 0.3 134.2 6.4
Jul 138.5 4.2 0.0 139.0 3.8 0.1 134.0 5.5
Aug 138.9 4.1 0.3 139.3 3.8 0.3 134.5 5.3
Sep 138.9 4.1 0.1 139.3 3.8 0.0 135.1 5.2
Oct 139.5 3.8 0.4 139.8 3.6 0.4 135.7 4.8
Nov 139.4 3.5 -0.1 139.5 3.2 -0.2 136.5 4.5
Dec 139.9 3.6 0.4 140.1 3.4 0.4 136.8 4.2
2026 Jan 139.4 3.2 -0.3 139.5 3.0 -0.5 137.0 3.9
Source: Consumer price inflation from the Office for National Statistics
Download this tableTable 1: CPIH, OOH component and CPI index values, and annual and monthly rates
.xls .csv
Figure 1: CPI annual inflation rate lowest since March 2025
CPIH, owner occupiers' housing (OOH) costs component and CPI annual inflation rates, UK, January 2016 to January 2026
CPIHCPIOOHJan 2026Jan 2025Jan 2024Jan 2023Jan 2022Jan 2021Jan 2020Jan 2019Jan 2018Jan 2017Jan 201602.557.51012.5%
Mar 2016
● CPIH: 0.8
● CPI: 0.5
● OOH: 2.1
Source: Consumer price inflation from the Office for National Statistics
Download this chartFigure 1: CPI annual inflation rate lowest since March 2025
Image .csv .xls
The Consumer Prices Index including owner occupiers' housing costs (CPIH) rose by 3.2% in the 12 months to January 2026, down from 3.6% in the 12 months to December 2025 (Figure 1).
On a monthly basis, CPIH fell by 0.3% in January 2026, while it was little changed in January 2025.
The Consumer Prices Index (CPI) rose by 3.0% in the 12 months to January 2026, down from 3.4% in the 12 months to December 2025.
On a monthly basis, CPI fell by 0.5% in January 2026, compared with a fall of 0.1% in January 2025.
The main drivers of the annual inflation rate for CPIH and CPI are the same where they are common to both measures. However, the OOH costs component accounts for approximately 18% of the CPIH and is the main driver for differences between the CPIH and CPI inflation rates. This makes CPIH our most comprehensive measure of inflation. We cover this in more detail in Section 4: Latest movements in CPIH inflation and provide a commentary on the CPI in Section 5: Latest movements in CPI inflation. We also cover both CPIH and CPI in Section 3: Notable movements in prices, though the figures reflect CPIH.
Back to table of contents
3.Notable movements in prices
Table 2: CPIH annual and monthly inflation rates by division
UK, January 2025, December 2025, and January 2026
CPIH 12-month rate (%) CPIH 1-month rate (%)
December 2025 January 2026 January 2025 January 2026
CPIH All items 3.6 3.2 0.0 -0.3
Food and non-alcoholic beverages 4.5 3.6 0.9 -0.1
Alcohol and tobacco 5.2 4.6 1.8 1.3
Clothing and footwear 0.0 0.0 -3.3 -3.3
Housing and household services 4.6 4.2 0.5 0.2
of which owner occupiers' housing costs 4.2 3.9 0.4 0.1
Furniture and household goods -0.6 -0.5 -2.3 -2.2
Health 2.1 3.1 0.7 1.7
Transport 4.0 2.7 -0.5 -1.8
Communication 4.2 4.6 0.0 0.4
Recreation and culture 2.7 2.6 0.3 0.2
Education 7.6 5.1 2.4 0.0
Restaurants and hotels 3.8 4.1 -1.0 -0.7
Miscellaneous goods and services 2.2 2.2 0.2 0.2
All goods 2.2 1.6 -0.1 -0.6
All services 4.5 4.3 0.0 -0.2
CPIH exc food, energy, alcohol and tobacco (core CPIH) 3.5 3.3 -0.2 -0.4
Source: Consumer price inflation from the Office for National Statistics
Download this tableTable 2: CPIH annual and monthly inflation rates by division
.xls .csv
Figure 2: Transport, and food and non-alcoholic beverages led the downward contributions to the change in CPIH annual inflation
Contributions to change in the CPIH annual inflation rate, UK, between December 2025 and January 2026
TransportFood and non-alcoholic beveragesHousing and household servicesof which owner occupiers' housing costsEducationAlcohol and tobaccoRecreation and cultureMiscellaneous goods and servicesClothing and footwearCommunicationFurniture and household goodsHealthRestaurants and hotels-0.10-0.175-0.15-0.125-0.075-0.05-0.0250.0250.05Percentage points
Source: Consumer price inflation from the Office for National Statistics
Notes:
Individual contributions may not sum to the total because of rounding.
More information on the contents of each division can be found in Table 3 of our accompanying Consumer price inflation dataset.
Download this chartFigure 2: Transport, and food and non-alcoholic beverages led the downward contributions to the change in CPIH annual inflation
Image .csv .xls
Figure 2 shows the contributions from the 12 divisions to the change in the annual Consumer Prices Index including owner occupiers' housing costs (CPIH) inflation rate between December 2025 and January 2026. These sum to the change in the annual rate between the latest two months, that is, the fall from 3.6% to 3.2%.
The fall in the rate into January 2026 reflected downward contributions from six divisions, partially offset by upward contributions from five divisions. The largest downward contributions were from the transport, food and non-alcoholic beverages, and housing and household services divisions.
Transport
Prices in the transport division rose overall by 2.7% in the 12 months to January 2026, down from 4.0% in the 12 months to December. On a monthly basis, prices fell by 1.8% in January 2026, compared with a fall of 0.5% a year ago.
The largest downward effect came from motor fuels, where the average price of petrol fell by 3.1 pence per litre between December 2025 and January 2026, compared with a rise of 0.8 pence per litre between December 2024 and January 2025. The average price stood at 133.2 pence per litre in January 2026, down from 137.1 pence per litre a year earlier.
Similarly, diesel prices fell by 3.2 pence per litre in January 2026, compared with a rise of 1.5 pence per litre in January 2025. The average price stood at 142.5 pence per litre in January 2026, up from 144.1 pence per litre a year earlier. These movements resulted in overall motor fuel prices falling by 2.2% in the 12 months to January 2026, compared with a rise of 0.9% in the 12 months to December 2025.
Figure 3: Monthly air fare prices fell by more in January 2026 than they did in January 2025
Air fares price indices rebased to January each year, UK, 2020 to January 2026
202020212022202320242025JanuaryNovemberSeptemberJulyMayMarchJanuary0100150200250Index points
December
● 2020: 129.5
● 2021: 166.1
● 2022: 203.3
● 2023: 173.0
● 2024: 120.9
● 2025: 137.0
Source: Consumer price inflation from the Office for National Statistics
Download this chartFigure 3: Monthly air fare prices fell by more in January 2026 than they did in January 2025
Image .csv .xls
The second-largest downward effect came from air fares, which tend to rise into December and fall into January (Figure 3). However, in December 2024 and January 2025, this pattern was less pronounced than in previous years. The monthly rise in December 2024 was the third-lowest December rise since monthly price collection began in 2001, and part of the reason for this lower-than-usual growth may have been because the return date for the European flights in December 2024's index was Christmas Eve, and the return date for long-haul flights was New Year's Eve. The weaker growth into December 2024 led to a smaller fall than normal into January 2025.
Whereas the pattern of air fares rising into December and falling into January was less pronounced last year, the index this year followed a more conventional pattern, perhaps because the return flights in December did not fall on Christmas Eve and New Year's Eve. The more pronounced rise into December 2025 and fall into January 2026 led to a large upward contribution to the change in the annual rate in December 2025 and a large downward contribution in January 2026.
Food and non-alcoholic beverages
Food and non-alcoholic beverages prices rose by 3.6% in the 12 months to January 2026, down from 4.5% in the 12 months to December 2025 (Figure 4). On a monthly basis, food and non-alcoholic beverages prices fell by 0.1% in January 2026, compared with a rise of 0.9% a year ago.
There were downward effects to the change in the rate from 6 of the 11 food and non-alcoholic beverages classes. These were,
bread and cereals - down 0.04 percentage points
meat - down 0.02 percentage points
milk, cheese and eggs - down 0.01 percentage points
food products not elsewhere classified - down 0.01 percentage points
coffee, tea and cocoa - down 0.01 percentage points
mineral waters, soft drinks and juices – down 0.01 percentage points
Housing and household services
The 12-month inflation rate for housing and household services was 4.2% in January 2026, down from 4.6% in December 2025. On a monthly basis, prices rose by 0.2% in January 2026, compared with a rise of 0.5% a year ago.
The easing in the 12-month rate between December 2025 and January 2026 mainly reflected a downward effect from owner occupiers' housing (OOH) costs. These rose by 3.9% in the 12 months to January 2026, compared with a rise of 4.2% in the 12 months to December 2025. The rate has slowed for 12 consecutive months and is at its lowest since February 2023, when it was also 3.9%. Monthly OOH costs rose by 0.1% in January 2026, compared with a 0.4% increase a year ago.
The easing in the 12-month rate between December 2025 and January 2026 also reflected a downward effect from gas, where prices fell by 2.7% in the 12 months to January 2026, compared with a rise of 2.1% in December 2025. Monthly gas prices fell by 3.4%, compared with a rise of 1.3% a year ago.
There was a counteracting upward effect from electricity, where prices rose by 5.3% in the 12 months to January 2026, compared with a rise of 2.7% in December 2025. Monthly electricity prices rose by 3.7% compared with a rise of 1.2% a year ago.
Education
Prices in the education division rose by 5.1% in the 12 months to January 2026, down from 7.6% in the 12 months to December 2025. On a monthly basis, prices were unchanged in January 2026, compared with a rise of 2.4% a year ago.
The downward contribution came entirely from private school fees, which rose by 12.7% a year ago after they became subject to Value Added Tax (VAT), and there was no change in price in January 2026.
Restaurants and hotels
Prices in the restaurants and hotels division rose by 4.1% in the 12 months to January 2026, up from 3.8% in the 12 months to December 2025. On a monthly basis, prices fell by 0.7% in January 2026, compared with a fall of 1.0% a year ago.
The largest upward contribution came from the hotel item where prices are collected the night before the stay, with prices falling by 8.8% in January 2026 compared with a fall of 12.2% a year ago.
Read the full ONS report HERE