Private rent and house prices UK: February 2026
19th February 2026
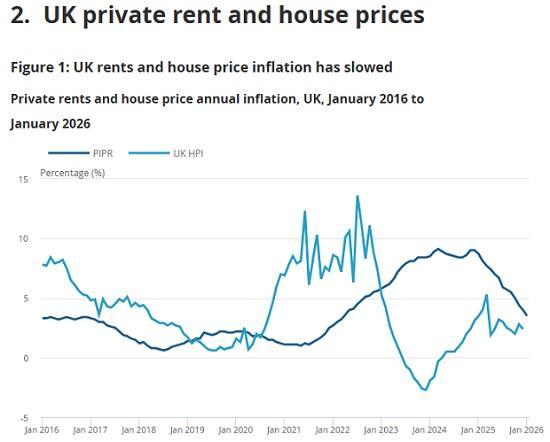
Average UK monthly private rents increased by 3.5%, to £1,367, in the 12 months to January 2026 (provisional estimate); this annual growth rate is down from 4.0% in the 12 months to December 2025.
Average rents increased to £1,423 (3.5%) in England, £826 (5.8%) in Wales, and £1,021 (2.6%) in Scotland, in the 12 months to January 2026.
In Northern Ireland, average rents increased to £875 (5.6%), in the 12 months to November 2025.
In England, private rents annual inflation was highest in the North East (8.0%), and lowest in London (1.1%), in the 12 months to January 2026.
Average UK house prices increased by 2.4%, to £270,000, in the 12 months to December 2025 (provisional estimate); this annual growth rate is down from 2.8%, in the 12 months to November 2025.
Average house prices increased to £292,000 (1.7%) in England, £215,000 (5.0%) in Wales, and £191,000 (4.9%) in Scotland, in the 12 months to December 2025.
House prices across the UK and by English region
The average house price for England was £292,000 in December 2025, up 1.7% (£5,000) from a year earlier. This annual rise was lower than in the 12 months to November 2025 (2.5%).
The average house price for Wales was £215,000 in December 2025, up 5.0% (£10,000) from a year earlier. This annual rise was higher than in the 12 months to November 2025 (0.9%).
The average house price for Scotland was £191,000 in December 2025, up 4.9% (£9,000) from a year earlier. This annual rise was unchanged from the 12 months to November 2025 (4.9%).
The average house price for Northern Ireland was £196,000 in Quarter 4 (October to December) 2025, up 7.5% (£14,000) from Quarter 4 2024.
READ THE FULL ONS REPORT HERE