The UKís Trade Deficit Widens: What March 2026 Tells Businesses About the Year Ahead
14th May 2026
The latest ONS trade figures for March 2026 reveal a UK economy grappling with rising import costs, uneven export performance and a shifting global environment.
For businesses, the message is not one of crisis, but of tightening margins, volatile markets and a trade position that is becoming harder to stabilise. The headline outcome is straightforward: the UK’s total trade deficit widened sharply in the first quarter of the year, driven by stronger growth in imports than exports and by a weakening surplus in services.
But the underlying dynamics are more complex, and they offer important clues about the pressures that firms may face through the rest of 2026.
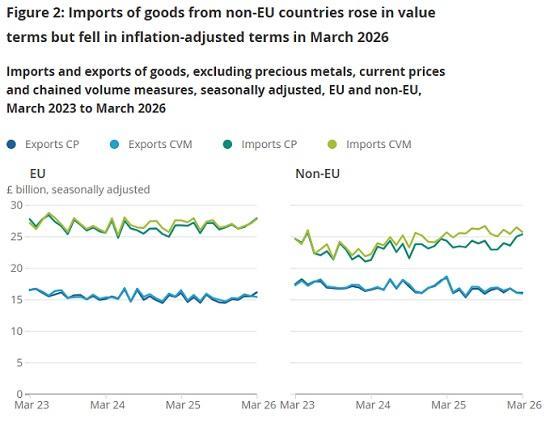
March itself delivered increases in both imports and exports of goods in cash terms. Imports rose by more than a billion pounds, while exports increased by around half that amount. Much of this movement was shaped by fuel prices. Higher refined oil imports from the EU and increased gas imports from Norway and the United States pushed up the value of inbound trade.
Exports to the EU also rose, helped by stronger sales of fuels and pharmaceuticals. Yet once inflation is stripped out, the picture becomes less flattering. Goods imports were flat in real terms, and goods exports actually fell. The apparent growth in trade was driven not by higher volumes, but by higher prices‚ÄĒparticularly in energy.
The quarterly figures reinforce this imbalance.
Imports of goods rose by more than six billion pounds in the first three months of the year, while exports increased by just over two billion. Imports from non‚ÄĎEU countries grew fastest, reflecting higher costs for fuels, machinery and transport equipment.
Exports to the EU strengthened, but sales to non‚ÄĎEU markets slipped slightly, with notable declines in manufactured goods and fuels. The result was a widening goods deficit that overshadowed the modest gains in exports.
Services, traditionally the UK‚Äôs strongest trade asset, offered less support than usual. Services imports were broadly unchanged, but services exports fell, driven mainly by a decline in travel‚ÄĎrelated activity.
Other business services provided some offset, yet not enough to prevent the overall services surplus from narrowing. Combined with the deepening goods deficit, this pushed the total trade deficit for the quarter to seven billion pounds‚ÄĒalmost triple the level of the previous quarter.
Revisions to earlier data added another layer of complexity. Corrections to HMRC export figures for the second half of 2025, particularly in fuel categories, resulted in downward adjustments to previous export totals. While these revisions do not alter the broad direction of travel, they highlight the volatility of commodity‚ÄĎdriven trade and the sensitivity of the UK‚Äôs external accounts to price movements in global energy markets.
For businesses, the implications of these trends extend well beyond the March figures. Rising import costs‚ÄĒespecially for energy and industrial inputs‚ÄĒsuggest continued pressure on margins. Firms that rely on imported components or fuel‚ÄĎintensive logistics may face further cost volatility as geopolitical tensions continue to influence global markets.
The divergence between EU and non‚ÄĎEU export performance also hints at a year in which market‚ÄĎspecific strategies will matter more than ever. Stronger demand from the EU may offer opportunities for some exporters, while weaker non‚ÄĎEU markets could require firms to rethink their sales mix or pricing strategies.
The weakening services surplus is another signal worth watching. If travel‚ÄĎrelated activity remains subdued, and if other business services fail to regain momentum, the UK‚Äôs traditional buffer against goods‚ÄĎtrade deficits may erode further. For companies in professional services, finance, consultancy and digital sectors, this could mean a more competitive international environment and greater pressure to differentiate.
Looking ahead to the rest of 2026, the trade outlook will depend heavily on global energy prices, the trajectory of inflation and the stability of key trading relationships. If fuel prices remain elevated, the UK’s import bill will continue to rise even if volumes fall. If global demand softens, exporters may struggle to maintain momentum outside the EU. And if services trade continues to weaken, the UK’s overall trade position may deteriorate further.
The March figures do not point to an immediate crisis, but they do underline the challenges facing the UK as it navigates a year marked by geopolitical uncertainty, shifting supply chains and persistent cost pressures. For businesses, the message is clear: resilience in 2026 will depend on careful cost management, diversified markets and a close eye on the global forces shaping the UK’s trade balance.
Main points from the ONS report 14 March 2026
The value of goods imports increased by £1.1 billion (2.1%) in March 2026 because of a rise in imports from both EU and non-EU countries.
The value of goods exports increased by £0.6 billion (1.9%) in March 2026, with a rise in exports to the EU.
The total goods and services trade deficit widened by £4.5 billion to a deficit of £7.0 billion in Quarter 1 (Jan to Mar) 2026, compared with the previous quarter.
The trade in goods deficit widened by £3.8 billion to £59.3 billion in Quarter 1 2026, while the trade in services surplus is estimated to have narrowed by around £0.7 billion to £52.3 billion.
Read he full ONS report HERE