Trade Figures
24th April 2019
Office For National Statistics has today, 24 April 2019 released Q4 2018 Trade in Services data, which show that exports and imports of services were higher in Q4 2018 than Q4 2017 by £2.6bn and £4.4bn respectively. Exports of services grew by £4.6bn between 2017 and 2018, while imports of services grew by £10.6 billon, leading to a narrowing of the trade in services surplus. In 2018, the largest country by service type export was of other business services to the US (£24.2bn) while the largest country by service type import was of travel services from Spain (£11.2bn).
Main points
This release covers all the UK economy's trade in services, presenting UK trade in services by 67 countries and 31 service types, on a non-seasonally adjusted basis.
Exports and imports of services were higher in Quarter 4 (Oct to Dec) 2018 compared with Quarter 4 2017, by £2.6 billion and £4.4 billion respectively.
The top five service types for exports and imports all increased in Quarter 4 2018 compared with the same quarter a year ago.
Exports of services grew by £4.6 billion between 2017 and 2018, while imports of services grew by £10.6 billon, leading to a narrowing of the trade in services surplus.
In 2018, the largest country by service type export was of other business services to the US, at £24.2 billion.
In 2018, the largest country by service type import was of travel services from Spain, at £11.2 billion.
The value of UK exports and imports of services increased in Quarter 4 2018 compared with Quarter 4 2017.
Exports and imports of services were higher in Quarter 4 (Oct to Dec) 2018 compared with the same quarter a year ago (Table 1). Exports increased by 3.5%, from £72.4 billion in Quarter 4 2017 to £75.0 billion in Quarter 4 2018. The value of imports increased by 11.4%, from £38.8 billion in Quarter 4 2017 to £43.2 billion in Quarter 4 2018.
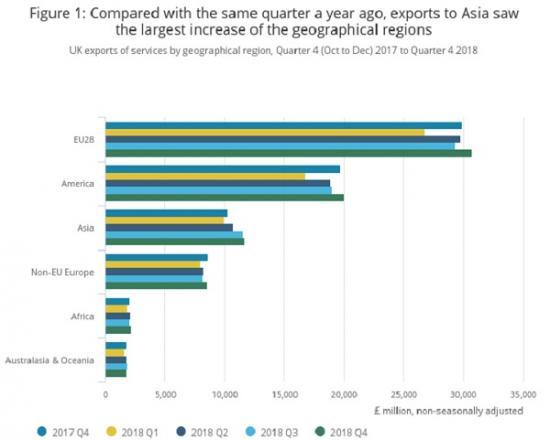
Exports of services in Quarter 4 2018 were higher than those reported in Quarter 4 2017 for most geographical regions
Compared with the same quarter a year ago, exports to Asia saw the largest increase of the geographical regions, rising from £10.3 billion in Quarter 4 (Oct to Dec) 2017 to £11.7 billion in Quarter 4 2018 (Figure 1). This was driven primarily by increasing exports of intellectual property, telecommunications, computer and information services, and other business services, which rose by £0.4 billion each.
Exports to the EU saw the second-largest rise of the geographical regions between Quarter 4 2017 and Quarter 4 2018, increasing by £0.8 billion. Insurance and pension services, and travel services both increased by £0.3 billion.
The only geographical regions that saw a decrease between Quarter 4 2017 and Quarter 4 2018 were non-EU Europe, falling by £0.1 billion, and Australasia and Oceania, which remained broadly flat.
The US remains the UK's largest trading partner for services exports
The US remains the UK's largest services export partner, accounting for £17.0 billion, or 22.7% of all UK exports of services in Quarter 4 (Oct to Dec) 2018 (Table 2). The value of exports to Germany was the second-highest at £5.0 billion, with exports to the Netherlands being the third-highest at £4.7 billion.
Exports to Germany and the Netherlands were equivalent to 6.7% and 6.2% of total UK services exports, respectively. Taken together, UK exports to the top three countries accounted for 35.6% of all UK services exports in Quarter 4 2018.
Exports of other business services remains the UK's largest export service type
The top five export service types all saw an increase in Quarter 4 (Oct to Dec) 2018 compared with Quarter 4 2017 (Table 3). Comparing Quarter 4 2018 with the same quarter a year ago, other business services and travel both had the largest increase in exports of £0.7 billion each. Of the top five export service types, the largest percentage rise of exports when comparing Quarter 4 2018 with Quarter 4 2017 is from telecommunications, computer and information services, increasing by 10.8%, followed by a 7.2% rise in travel services being exported.
Other business services, which includes research and development, professional and management consulting services, and technical, trade-related and other business services not included elsewhere, continues to be the largest export service type, accounting for 30.7% of total services exports in Quarter 4 2018.
Imports of services in Quarter 4 2018 were higher than those reported in Quarter 4 2017 for most geographical regions
Compared with the same quarter a year ago, imports from the EU saw the largest increase among geographical regions of £2.4 billion, rising from £18.8 billion in Quarter 4 (Oct to Dec) 2017 to £21.2 billion in Quarter 4 2018 (Figure 4). This was driven primarily by imports of other business services, which increased by £1.2 billion. Of this, France had the largest increase of imports of other business services, accounting for £0.6 billion.
Imports from Asia saw the second-largest increase of £1.4 billion in Quarter 4 2018, compared with Quarter 4 2017. Services imports from Japan increased by £0.5 billion, driven by imports of financial services, which rose by £0.3 billion.
The only geographical regions that saw a decrease between Quarter 4 2017 and Quarter 4 2018 were Australasia and Oceania, falling by £0.1 billion, and Africa, which remained broadly flat.
Read the full report HERE