Who Are Business Owners And What Are They Doing?
18th July 2019
Executive summary
Business owners have been the fastest-growing part of the UK labour force since at least 2000. Between 2000-01 and 2015-16, the number of employees grew by 15%, while self-employment (including those operating as a sole trader or as a partner in a partnership) grew by 25% and the number of directors of companies with at most two directors more than doubled. The number of new businesses created in the UK between 2007-08 and 2015-16 was higher than in any other OECD country.
This is an important labour market trend and is often hailed as a success because small businesses and start-ups are commonly viewed as the engines of growth. This is questionable in light of evidence that the UK has a long tail of low-productivity firms. However, to date, our understanding of business owners has been limited because they are not well captured in traditional survey data sources. Learning more about this group is crucial for understanding labour market trends better and informing public policy as it relates to business owners.
In this report, we use the universe of business owners' administrative tax records provided by HM Revenue and Customs (HMRC) to learn more about business owners and their businesses than has previously been possible using survey data. Specifically, using these data, this report documents the numbers, characteristics, incomes and business activities of business owner-managers in the UK. We track the same business owners over time – something that has not been possible before – and use this to analyse patterns of business start-up and closure and to explain substantial falls in sole trader incomes since 2008.
Key findings
Number of business owners
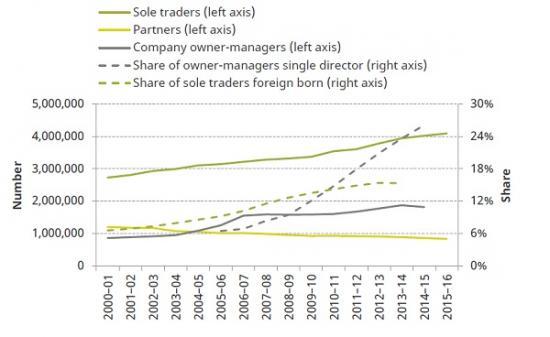
In 2015–16, there were 4.9 million people operating through self-employment, up from 3.9 million in 2000–01 (Figure E.1). Growth is driven entirely by sole traders; the number of partners (owners of multiple-owner unincorporated businesses) has been falling. The number of foreign-born sole traders more than doubled between 2007–08 and 2013–14, and accounted for one-third of net growth in the sole trader population over that period.
In 2014–15, there were 1.8 million company owner-managers, up from 0.9 million in 2000–01 (Figure E.1). All of the growth in this population since 2007–08 is accounted for by owner-managers of one-director companies; this is the fastest-growing legal form.
Note: Company owner-managers are directors of companies with one or two directors. ‘All business owners' include sole traders, partners and company owner-managers; see Appendix A for precise definitions. We have data on company owner-managers up to 2014–15. The share of sole traders who are foreign born is shown up to 2013–14 (the latest year for which we have those data). ‘Share of owner-managers single director' shows the share of company owner-managers (directors of one- or two-director companies) who are directors of one director companies from 2005–06.
Source: Data for business owners from authors' calculations based on HMRC administrative data sets. Number of employees from the Labour Force Survey; ONS series MGRZ.
Business owners’ characteristics
Business owners are disproportionately men and, on average, are older than employees. Almost 70% of owners of single-owner businesses are men. The majority of businesses with two partners or directors have one male and one female partner or director respectively; it is highly likely that such configurations reflect a high prevalence of spouses as business partners.
Combining business and employment activity is common but not new. One-quarter of the self-employed also have some income from employment, but this share has been remarkably stable over time (it was 25%, 24% and 25% in 2000–01, 2007–08 and 2015–16 respectively).
Business owners’ incomes
Average sole trader incomes are very low and have been falling. The mean annual taxable income (from all sources) of sole traders was £21,000 in 2015–16 (£10,000 below that of employees) and 36% have taxable income below £10,000. The income sole traders derive from their business (profit) is even lower on average (£12,100) and has fallen by £3,300 (21%) in real terms since 2007–08.
Partners are significantly over-represented in the top 1% of all income tax payers. 7% of all partners are in the top 1% of income tax payers and together they earn 60% of all partnership income. This is an extremely top-heavy distribution of income, reflecting both the very high incomes of some partners and the very low incomes of many others.
Company owner-managers have higher average incomes than the self-employed and retain income in their companies. Mean annual taxable income of owner-managers is £43,000, and 2% are in the top 1% of taxpayers. Many owner-managers are earning more income each year than they take out of their companies (i.e. more than their personal taxable income suggests), because they are incentivised by the tax system to, and do, retain profits within the company.
Investment and employment
Employment and investment among sole traders is low. 23% of sole traders have total business costs of less than £1,000 and 70% have total business costs below £10,000. Most sole trader businesses are not employing anyone else and less than a quarter make any use of deductions for capital investment.
Owner-managed companies have higher costs than sole traders on average, but contain a wide range of business models. There is substantial variation in the business costs of owner-managed companies: 25% have costs below £10,000 and 21% have costs above £100,000. There are systematic differences across industries that likely reflect different business models; costs are lower in business services, financial services and the medical industry, where business income is more likely to predominantly reflect a return to the owner-manager’s labour.
Business start-up and closure
Rates of entry and exit are high, especially for sole traders. For example, between 2014–15 and 2015–16, the sole trader population grew by almost 70,000, but this was the net effect of 650,000 sole traders starting up and 580,000 exiting (Figure E.2). Rates of entry and exit have been high since at least the turn of the millennium, and imply a fluid transition between business ownership and other labour market statuses.
Many more people will have tried their hand at business ownership at some point than are currently business owners. Between 2011–12 and 2015–16, 6 million people were sole traders for at least one year, and only 2.4 million were sole traders in all five years.
Most new sole trader businesses close relatively quickly. 20% of newly set-up sole traders are not trading after their first year; 60% have ceased trading by year 5 and 80% have ceased after 12 years.
A minority of sole trader business ‘closures’ represent incorporation. The tax advantages to incorporation are higher for higher-income sole traders. Around 30% of company owner-managers had sole trader income in at least one year prior to their company being established, but this only represents 10% of sole trader closures since 1997–98.
All else equal, sole traders who are aged 35–54, have been trading for longer, and have higher profits and/or sales are more likely to keep trading for an extra year.
The fall in sole trader profits since 2008
Aggregate profit of all sole traders fell 2% in real terms between the financial crisis and 2015–16, despite there being 25% (800,000) more sole traders. This resulted from very large falls in average sole trader profits. These falls in profit are consequential: they represent falling living standards for individuals and households, and falling value added from the sole trader sector of the economy.
A higher fraction of sole traders have very low profits than before the financial crisis; the fraction with profits over £40,000 has halved. 14% of sole traders have profits of between £0 and £2,000, up from 12% in 2007–08. 4% have profits above £40,000, down from 7% in 2007–08.
Large falls in average profits are explained by ‘stayers’ – those who remain in self-employment – rather than by new entrants or those who exit. Falls in average profit were largest in the period 2007–08 to 2011–12; over these four years, mean (median) profits fell by 23% (16%). During this period, both entrants and those who exited had lower-than-average profit (pulling the average down and up respectively) but this was also true before the recession. What stands out between 2007–08 and 2011–12 is that the profits of ‘stayers’ fell by £2,500 (16%), when ordinarily – both before and after this period – the profits of stayers rise over time.
For more details see the full report from the Institute for Fiscal Studies at -
https://www.ifs.org.uk/uploads/R158_Who_are_business_owners_and_what_are_they_doing.pdf